Trading Strategies · Lesson 3/57 · 5 min read
Mean Reversion Strategy
In this article
- Mean Reversion: "The Rubber Band Eventually Snaps Back"
- The Main Tool: Bollinger Bands
- Using RSI for Oversold Bounces
- A Basic Trading Rule Example
- When Mean Reversion Works — And When It Doesn't
- Comparing the Three Strategies So Far
- Ways to Improve It in Practice
- Z-Score: Putting a Number on Overbought/Oversold
- Pairs Trading: Applying Mean Reversion to a Relationship Between Two Stocks
- Summary
Mean Reversion: "The Rubber Band Eventually Snaps Back"
Mean reversion sits on the opposite philosophy from momentum. It's based on the premise that when price strays too far from its normal range (its average), it tends to snap back toward that average. The common analogy: stretch a rubber band too far, and it eventually pulls back.
Where a momentum trader "buys a stock that's already rising, at an even higher price," a mean reversion trader takes the opposite approach: "buy a stock that has fallen too far, too fast, and sell once it reverts back toward the average" (the strategy also works in reverse — selling a stock that has risen too far, too fast).
The Main Tool: Bollinger Bands
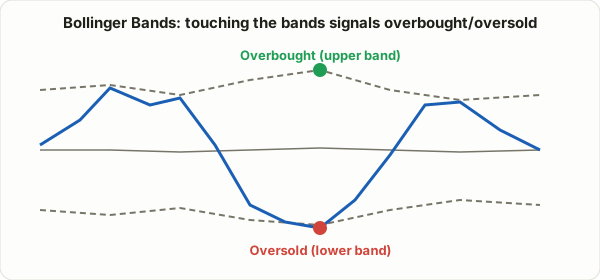
Bollinger Bands are an indicator that draws bands above and below a moving average, based on standard deviation.
Upper band = Moving average + (Standard deviation × 2)
Middle line = N-day moving average
Lower band = Moving average - (Standard deviation × 2)
On the premise that price statistically stays within the upper and lower bands most of the time (roughly 95%), touching or breaking below the lower band is read as "the price has fallen too far," and touching or breaking above the upper band is read as "the price has risen too far."
Using RSI for Oversold Bounces
RSI, covered in the previous lesson, gets interpreted in reverse under a mean reversion lens.
- Momentum view: RSI above 70 = a sign the trend is strong (consider holding or adding)
- Mean reversion view: RSI below 30 = short-term oversold, possible bounce (consider buying) / RSI above 70 = short-term overbought, possible pullback (consider selling)
It's interesting that the same indicator gets read in exactly opposite ways depending on which strategy philosophy you're applying it through.
A Basic Trading Rule Example
- Look for stocks that have broken below the lower Bollinger Band or dropped below RSI 30.
- Look for a bounce signal (e.g., a candle with a long lower wick, a bounce accompanied by rising volume).
- After entering, use the middle band (moving average) as a first target.
- Set your stop at a clear invalidation point, such as below the recent low.
When Mean Reversion Works — And When It Doesn't
💡 Mean reversion tends to work especially well in a sideways (range-bound) market. When price is oscillating within a range with no clear direction, buying near the lower band and selling near the middle or upper band can work repeatedly.
⚠️ It can be genuinely dangerous in a strong trending market. A stock in a real downtrend can break below the lower Bollinger Band and just keep falling ("catching a falling knife"). Mechanically buying every time price touches the lower band can get you repeatedly caught at the start of a real downtrend.
Comparing the Three Strategies So Far
| Moving average crossover | Momentum | Mean reversion | |
|---|---|---|---|
| Core philosophy | Confirm trend reversal, then follow | Ride the strong move | Extremes revert to the average |
| Works best in | Clear trending market | Strong trending market | Range-bound market |
| Most dangerous in | Range-bound market (whipsaw) | Sudden trend reversal | Strong one-directional trend (falling knife) |
As this table shows, no single strategy works in every market condition. Figuring out whether the current market is trending or range-bound first, and then choosing the strategy suited to it, is one of the most important practical skills in trading.
Ways to Improve It in Practice
- Combine with a trend filter: Ignore or downweight mean reversion buy signals when the long-term moving average is in a clear downtrend
- Look for confluence: Prioritize setups where a lower Bollinger Band touch, RSI oversold, and a nearby support level all line up at once
- Always pair with a stop: The "it reverts eventually" premise doesn't always hold, so a stop for when it doesn't is essential
Z-Score: Putting a Number on Overbought/Oversold
Where Bollinger Bands give you a rough read on "inside the bands or outside," the Z-score gives you an exact number for how many standard deviations away from the average the current price sits.
Z-score = (Current price - Moving average) ÷ Standard deviation
A Z-score of -2 means "2 standard deviations below the average" — statistically, a move that extreme isn't common (roughly 2.3% of the time, assuming a normal distribution). Setting a concrete numeric threshold like "consider buying when the Z-score drops to -2 or below" lets you trade with a more consistent rule than eyeballing whether price has touched a band.
Pairs Trading: Applying Mean Reversion to a Relationship Between Two Stocks
Mean reversion doesn't have to apply to a single stock's price — it can also apply to the price gap (spread) between two stocks that normally move together. This is called pairs trading.
For example, say Company A and Company B, in the same sector, normally move at a similar ratio to each other. One day, A jumps sharply with no news while B stays flat. A pairs trader might short A and buy B, on the premise that "this spread will eventually revert to its normal level." Because you're buying one and shorting the other simultaneously, this approach bets purely on the spread reverting, largely independent of the overall market direction. The risk is that if the structural relationship between the two stocks genuinely breaks (say, one company suffers a truly major setback), the spread may never revert and can keep widening instead.
Summary
- Mean reversion is based on the premise that price snaps back toward its average after moving too far away — the opposite philosophy from momentum.
- Bollinger Bands and RSI are the primary tools for identifying overbought/oversold extremes.
- It performs well in range-bound markets, but carries real "falling knife" risk in strong trends, which is why a stop discipline is especially important.
In the next lesson, we'll cover one of the most fundamental concepts in charting: the support/resistance breakout strategy.