Trading Strategies · Lesson 5/57 · 5 min read
ICT Smart Money Concepts Basics
In this article
What Is ICT / Smart Money Concepts
ICT (Inner Circle Trader) refers to both the trading framework developed by trader Michael J. Huddleston and the educational community he built around it. It's often referred to as Smart Money Concepts (SMC). The core idea:
The market isn't moved by the small orders of individual retail traders — it's driven by the large order flow of "smart money": banks and large institutions. If you can read the traces they leave behind while filling those large orders (liquidity hunts, price imbalances, and so on) on a chart, you can position yourself alongside that flow.
This lens uses a different vocabulary and logical structure than traditional technical analysis like support/resistance or moving averages. Let's cover the three most central concepts.
⚠️ Worth knowing upfront: ICT concepts are popular in trading communities, but they aren't a formally validated theory in academia or institutional finance. Claims about "exactly how banks place orders" are inherently hard to verify publicly, and figures like "80% win rate" commonly cited on YouTube are mostly unverified claims. Treat the concepts below as one analytical framework that many traders find useful rather than proven fact, and strongly consider backtesting against historical data yourself before applying any of it with real money.
1. Liquidity
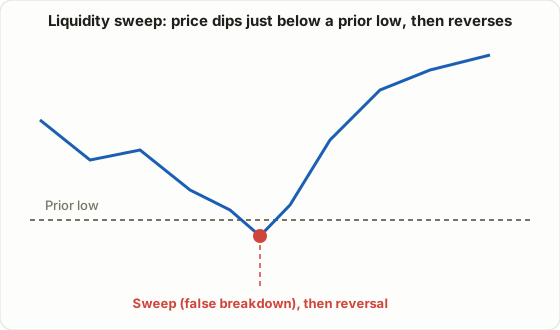
Here, "liquidity" is used more specifically than its everyday meaning of "how easy something is to buy or sell." It refers to the cluster of stop-loss and pending orders sitting just above or below a recent high or low.
- Just below a recent low: Where stop-loss sell orders from traders holding long positions tend to cluster
- Just above a recent high: Where stop-loss buy orders from traders holding short positions tend to cluster
From the ICT perspective, a participant trying to fill a large order will deliberately push price to one of these levels to trigger the resting orders clustered there, using that liquidity to fill their own position. This move — briefly poking through a recent high or low before quickly reversing — is called a liquidity sweep.
2. Fair Value Gap (FVG)
An FVG forms when price moves very quickly in one direction, leaving a gap across three consecutive candles where no trading occurred. Specifically (for a bullish FVG), it refers to the gap between the first candle's high and the third candle's low.
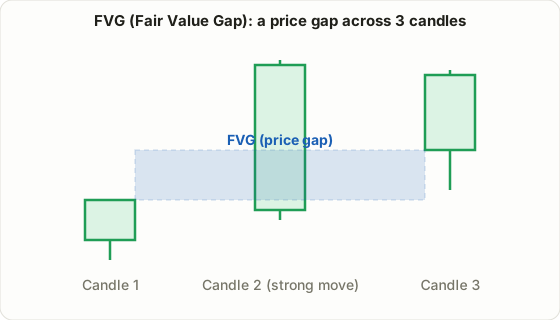
From the ICT perspective, a zone where "price moved so fast that buyers and sellers didn't fully exchange" is seen as a level price is more likely to return to and "fill" later. FVGs are therefore commonly used as pullback entry zones when re-entering in the direction of the trend.
3. Higher Timeframe Bias + Confirm DOL
The typical ICT trading flow follows this sequence:
- Determine direction on the Higher Time Frame (HTF): For example, look at where an FVG sits on the 15-minute or 1-hour chart to set an overall bias — "we're looking to buy" or "we're looking to sell."
- Set the DOL (Draw On Liquidity): Set a target based on the next liquidity pool price is likely to be drawn toward in that direction (a recent high/low, the prior day's high/low, and so on).
- Confirm entry on the Lower Time Frame (LTF): Only actually enter once a specific signal — a liquidity sweep plus FVG formation — shows up on a shorter timeframe, like the 5-minute chart.
Put together, this is a top-down analysis structure: set direction on the big picture → set a target for how far it should go → drop down to a short timeframe to time the entry precisely.
Time + Price
The ICT framework also places weight on when a move happens. Under the premise that institutional capital tends to flow in during specific windows of the day (like right after the New York open), some traders prioritize entry signals only during specific "killzone" windows. Whether the current price sits above (premium) or below (discount) the day's opening price is also commonly used as a reference for buy/sell decisions.
SMT Divergence: Comparing Two Related Assets
The ICT framework also includes a concept called SMT Divergence (Smart Money Divergence), which involves placing two related assets side by side — say, two large-cap stocks in the same sector, or the Nasdaq and S&P 500 indexes.
If two assets that normally move together suddenly diverge — one makes a new high (or low) while the other fails to — that's called a divergence. The logic: "these two are supposed to move together, and one of them failing to keep up" is read as a sign the move's real underlying strength is weak, and gets used alongside liquidity sweeps or other reversal signals.
⚠️ This can look similar to the pairs trading from Lesson 3, but the approach differs. Pairs trading buys one and shorts the other simultaneously on the statistical premise that "the spread reverts to its mean." SMT divergence instead treats the gap between the two as a hint about a potential direction change, and uses it as a reference while trading only one of the two assets.
Summary
- ICT / smart money concepts is a trading framework built around the idea of "reading the traces large institutional order flow leaves behind."
- Liquidity sweep: A brief poke through a recent high or low, triggering resting stop orders, followed by a reversal
- FVG (Fair Value Gap): A price gap left by a fast move, commonly used as a pullback entry zone
- The typical structure is top-down: set direction and target (DOL) on a higher timeframe, then time entries precisely on a lower timeframe
- It isn't an academically validated theory, so treat it with healthy skepticism and verify with real data rather than taking it on faith
In the final lesson, we'll close out the strategies course with something that applies no matter which strategy you use: risk/reward ratio and money management.