Trading Strategies · Lesson 83/83 · 10 min read
Factor Investing Explained: Value, Momentum, Quality, and Low-Volatility Factors
In this article
- Picking Traits Instead of Picking Stocks
- Where the Idea Came From: From CAPM to Multi-Factor Models
- The Five Core Factors
- Why It Works: Risk Premium or Behavioral Bias?
- A Worked Numeric Example: Scoring Stocks on Two Factors
- Why Combine Factors: Value and Momentum Cover Each Other's Blind Spots
- Implementation: Smart Beta ETFs vs. DIY Screening
- Factor Investing vs. CANSLIM: Rules-Based, but Different in Scope
- Limitations and Caveats
- FAQ
- Summary
Picking Traits Instead of Picking Stocks
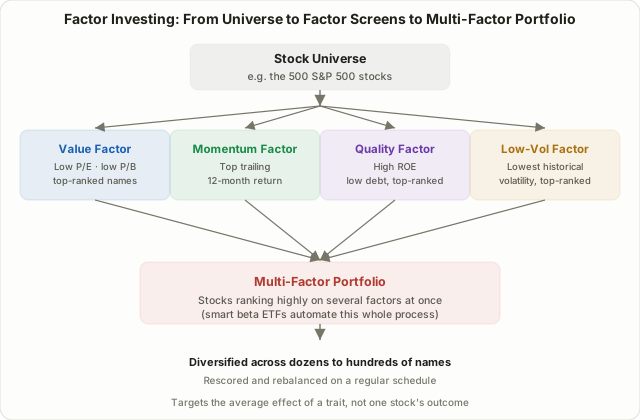
Nearly every strategy covered earlier in this course answers one question at a time: should I buy this specific stock, right now? Factor investing flips that question around. Instead of asking "is this stock good," it asks "which shared, measurable traits have historically been linked to better-than-average returns across hundreds of stocks," and then builds a portfolio that systematically tilts toward stocks carrying those traits.
Decades of academic research point to a consistent pattern: stocks that recently outperformed, as a group, tend to keep outperforming for a while; stocks that are cheap relative to their fundamentals, as a group, have tended to beat expensive ones over long stretches. Factor investing doesn't try to call a single winner — it holds hundreds of names that share a documented trait and lets the average effect of that trait play out. Lesson 41's CANSLIM screens individual growth stocks one at a time against seven specific criteria; factor investing takes a similar "screen by rule, not by gut feeling" philosophy and applies it systematically across an entire universe of stocks at once.
Where the Idea Came From: From CAPM to Multi-Factor Models
The concept traces back to the Capital Asset Pricing Model (CAPM) in the 1960s, which claimed a stock's return could be explained by exactly one thing: its sensitivity to the overall market (beta). Over the following decades, though, researchers kept finding systematic patterns in stock returns that beta alone couldn't explain.
The turning point came in 1992–1993, when Eugene Fama and Kenneth French published their now-famous three-factor model. Adding two traits on top of market beta — "small companies tend to outperform large ones" (size) and "cheap companies tend to outperform expensive ones" (value) — explained a meaningfully larger share of stock returns than beta alone. In 1997, Mark Carhart extended this into a four-factor model by adding momentum: "stocks that recently went up tend to keep going up for a while." Quality and low volatility were added later by other researchers and practitioners, and that five-factor set is now the most widely used factor framework in the industry. The key point is that factor investing didn't start as a trader's hunch — it's a framework refined through decades of peer-reviewed empirical testing.
The Five Core Factors
The five factors most consistently cited in the academic and practitioner literature are:
| Factor | Typical measure | Core idea | Example ETF |
|---|---|---|---|
| Value | Low P/E, low P/B, low P/S | Stocks cheap relative to fundamentals tend to outperform over the long run | VLUE |
| Momentum | Trailing 3–12 month return | Recent relative winners tend to keep winning in the near term | MTUM |
| Quality | High ROE, low debt, stable earnings | Financially healthy companies hold up better through downturns | QUAL |
| Low Volatility | Low historical price volatility (beta) | Steadier stocks have historically delivered better risk-adjusted returns | USMV |
| Size | Smaller market capitalization | Small-cap stocks carry a higher average risk premium | IWM |
One important caveat belongs right next to this table: the "example ETF" column is illustrative, not a recommendation, and different fund providers chasing the "same" factor can define and measure it quite differently — different lookback windows, different rebalancing schedules, different screening thresholds. Two "momentum ETFs" can end up holding meaningfully different stocks.
Why It Works: Risk Premium or Behavioral Bias?
There's no single, fully agreed-upon explanation in academic finance for why factors have historically delivered excess returns. Two competing views dominate the discussion.
The risk-based view holds that factor premiums aren't a free lunch — they're fair compensation for extra risk investors are taking on. Value stocks are often cheap for a reason (slowing earnings, a declining industry), and the market pays a higher long-run return as compensation for bearing that risk.
The behavioral view holds that the premium comes from systematic psychological biases among investors. For momentum, a commonly cited explanation is underreaction: investors absorb new information gradually rather than instantly, which lets a trend persist longer than pure rationality would predict. For low volatility, one explanation is that many investors chase high-volatility, "lottery-like" stocks hoping for a big win, which can leave steadier, lower-volatility stocks relatively underpriced.
What matters in practice is this: regardless of which explanation is correct, factor premiums do not show up reliably every day or every month — they can disappear, or even reverse, for stretches lasting several years. The value factor's extended period of underperformance against momentum and quality from roughly the mid-2010s through 2020 is frequently cited as a real-world example of this. Factor investing isn't a formula that wins every time — it's a probabilistic edge that has historically shown up over long enough time horizons, not a guarantee for any given year.
A Worked Numeric Example: Scoring Stocks on Two Factors
Here's a simplified illustration of how a multi-factor portfolio actually ranks candidates. Suppose a hypothetical universe of five stocks is scored 1–5 on two factors: value (a lower P/E earns a higher score) and momentum (a higher trailing 12-month return earns a higher score).
| Stock | P/E | Value score | 12-month return | Momentum score | Combined score |
|---|---|---|---|---|---|
| A | 8x | 5 | +5% | 2 | 7 |
| B | 25x | 2 | +45% | 5 | 7 |
| C | 12x | 4 | +28% | 4 | 8 |
| D | 40x | 1 | +60% | 5 | 6 |
| E | 10x | 5 | -5% | 1 | 6 |
By combined score alone, Stock C ranks highest — solid on both value and momentum at once. Stock A has the best possible value score but weak momentum (a potential "value trap"), while Stock D has strong momentum but a poor value score (closer to an expensive, crowded-favorite stock). Real multi-factor ETFs apply this same logic — summing or weighting multiple factor scores to rank a universe — though actual products add considerably more complexity: factor weighting schemes, sector-neutrality constraints, and defined rebalancing calendars.
Why Combine Factors: Value and Momentum Cover Each Other's Blind Spots
Look again at Stocks A and D above, and a pattern emerges: stocks that score well on value tend to score poorly on momentum, and vice versa. That's not a coincidence — it's a structural feature of the two factors. Value tends to favor stocks that haven't moved up much recently (or have fallen), while momentum, by definition, favors stocks that have just moved up a lot. On average, the two factors carry a negative correlation to each other.
This is the central appeal of a multi-factor portfolio. During stretches when value lags (typically strong momentum- or growth-led markets), momentum tends to pick up the slack; during sharp trend reversals, value has tended to hold up relatively better. Blending factors with offsetting behavior tends to smooth out portfolio-level volatility more than concentrating in any single factor alone — which is exactly why multi-factor approaches are generally recommended over single-factor ones.
Implementation: Smart Beta ETFs vs. DIY Screening
There are two practical ways to put factor investing to work.
| Buying a smart beta ETF | Building your own factor screen | |
|---|---|---|
| Effort required | Buy one fund, done | Gather fundamental data, score stocks, rebalance on your own schedule |
| Cost | Annual expense ratio (commonly around 0.15–0.4%) | Trading commissions plus your own time (fees can otherwise be low) |
| Transparency | Depends on the provider's published methodology | You control every rule yourself |
| Customization | Limited to what the fund's rules already specify | Full freedom to design your own factor mix and weighting |
| Best suited for | Investors who want simple, low-effort factor exposure | Investors with a specific view on factor combinations and time to run it |
Smart beta ETFs essentially automate this factor-screening process into a rules-based product accessible with a small amount of capital. But the label "smart beta" shouldn't be taken to mean every provider's methodology is identical — two funds marketed under the same factor name can hold very different stocks. Before buying, check the fund's official index methodology, rebalancing frequency, and expense ratio directly from the provider rather than relying on the marketing description.
Factor Investing vs. CANSLIM: Rules-Based, but Different in Scope
Lesson 41's CANSLIM and factor investing share a philosophy — screen by defined rules rather than discretion — but apply it very differently.
| Factor Investing | CANSLIM | |
|---|---|---|
| Scope | Filters an entire universe (hundreds to thousands of stocks) | Screens individual stocks against seven specific criteria, one at a time |
| Portfolio shape | Broadly diversified across dozens to hundreds of names | Concentrated in a relatively small number of names |
| Room for discretion | Rules execute mechanically once set (fully automated in an ETF) | Some discretionary judgment enters when reading base patterns and pivot points |
| Stock character | Spans value, momentum, and other styles simultaneously | Concentrated in fast-growing earnings and sales stories |
| Ease of execution | Easily accessed through a smart beta ETF | Requires hands-on reading of financial statements and charts |
If CANSLIM is a sniper hunting for a small number of exceptional growth stocks, factor investing is closer to a shotgun — broad exposure to an entire group of stocks that share a documented trait. Neither approach is objectively superior; the right choice depends on how much analytical time and conviction an individual investor can bring to the table.
Limitations and Caveats
- Factor crowding. As a factor becomes more widely known, more capital chases products built around it, which can erode the very premium that made the factor attractive in the first place. Edges that are common knowledge tend to compress over time.
- Long stretches of underperformance are part of the deal. As noted above with value, a factor can lag the broad market for years at a time. An investor who abandons the approach mid-drawdown never gets to realize the long-run statistical edge the research actually points to.
- Methodology varies by provider. Two "quality ETFs" can hold very different portfolios depending on whether the provider weights ROE, debt levels, or earnings stability most heavily.
- Costs and taxes matter. As Lesson 13's ATR and Net-Profit Risk Filters emphasizes for any strategy, results should always be judged after fees and slippage, not before. Factor products that rebalance frequently can rack up more trading costs and taxable events than expected.
- Backtests describe the past, not the future. Most of the factor research built on Fama-French's framework is grounded in historical data, and there's no guarantee the same strength of effect persists going forward.
FAQ
Is factor investing active or passive?
It sits somewhere in between. Like passive investing, it executes mechanically by rule rather than picking stocks by discretion. But unlike plain market-cap-weighted indexing, it deliberately overweights specific traits instead of weighting every stock by its market value — an active choice. That's why it's often described as "rules-based active" investing, a middle ground between the two.
Is one single factor ETF enough?
It can work, but it carries the full risk of that one factor's long underperformance stretches, described above. Blending two or three factors with low or negative correlation to each other — either through a multi-factor fund or by holding several single-factor ETFs together — is commonly recommended to smooth out that volatility.
Do factors work the same way in every market or sector?
Not necessarily. Research generally finds that factor strength and persistence vary by market and time period. An effect well-documented in US large-cap stocks may show up with different strength in emerging markets or specific sectors, and higher trading costs or lower liquidity in some markets can make the same factor harder to capture in practice.
Summary
- Factor investing builds a portfolio by systematically tilting toward stocks sharing academically documented traits — value, momentum, quality, low volatility, and size — rather than picking individual winners.
- The framework grew out of Fama-French's and Carhart's academic research in the 1990s, with risk-based and behavioral explanations still competing to explain why the premiums exist.
- Combining factors that are negatively correlated with each other, like value and momentum, tends to smooth out volatility more than concentrating in a single factor, which is why multi-factor approaches are widely recommended.
- Smart beta ETFs automate this screening process and make it accessible, but methodology varies meaningfully by provider — always verify the actual index rules before buying.
- Factor premiums are a probabilistic, long-run statistical tendency, not a guarantee in any given year, and underperformance stretches lasting years are a real possibility that requires patience and adequate time horizon.