Trading Strategies · Lesson 41/57 · 9 min read
CANSLIM Strategy: William O'Neil's 7-Factor Checklist for Finding Big Winning Stocks
In this article
- CANSLIM: The Winners All Share Something in Common
- The 7 CANSLIM Factors
- Why This Particular Combination Keeps Showing Up
- Entry Timing: Bases and the Pivot Point
- Stop-Loss and Sell Rules
- A Worked Numeric Example (Simplified, Educational)
- CANSLIM vs. VCP: What's the Difference
- Limitations to Keep in Mind
- FAQ
- Summary
CANSLIM: The Winners All Share Something in Common
CANSLIM is a stock-screening framework developed by William O'Neil, the American investor who founded Investor's Business Daily. Starting in the 1950s, O'Neil worked backward through decades of the biggest-winning stocks — studying their charts and financial statements to isolate seven traits that kept showing up right before a stock's biggest rally. He named the framework after the first letter of each trait: CANSLIM.
What sets it apart from most of the other strategies in this course — things like the moving average crossover or VCP, which are purely technical — is that CANSLIM fuses fundamental analysis (earnings growth) with technical analysis (chart patterns, volume, relative strength) into a single checklist. Instead of treating "is this a good company" and "is this a good time to buy" as separate questions, it only passes a stock through when both are true at once.
The 7 CANSLIM Factors
| Letter | Meaning | Rough guideline (a convention, not a hard rule) |
|---|---|---|
| C | Current Quarterly Earnings | The latest quarter's EPS grew sharply year-over-year (25%+ is a commonly cited threshold, not an absolute) |
| A | Annual Earnings Growth | Annual EPS growth has trended steadily upward over the past 3 years |
| N | New | Something new — a new product, new management, a new industry shift, or the stock is hitting new highs |
| S | Supply and Demand | A relatively small float, with volume that expands on up days and contracts on down days |
| L | Leader or Laggard | Strong relative strength (RS) within its sector — a category leader, not a follower |
| I | Institutional Sponsorship | A rising trend in ownership by mutual funds, pension funds, and other large institutions |
| M | Market Direction | Is the broader index itself in an uptrend — if not, even a stock that checks every other box has a much lower odds of success |
Why This Particular Combination Keeps Showing Up
Each factor looks fairly obvious on its own. What makes CANSLIM distinctive is that it requires all of them at once. Here's the market mechanics behind why that combination matters.
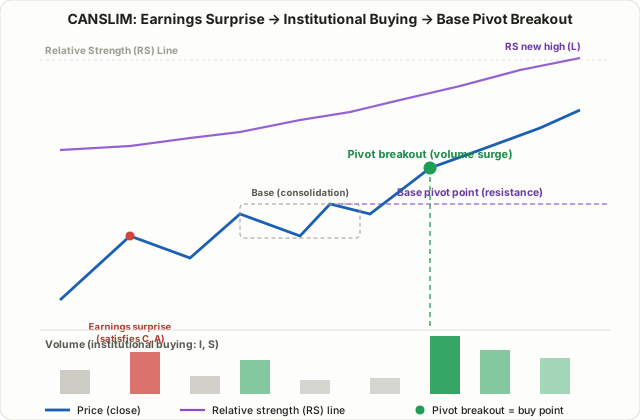
C and A (earnings growth) are the trigger for repricing. When earnings come in well above expectations, the analysts covering that stock start raising their price targets and earnings estimates. That adjustment rarely happens in a single day — it tends to play out gradually over weeks or months, which lines up almost exactly with the observation behind Lesson 36's PEAD (post-earnings-announcement drift): the market doesn't fully price in new information all at once.
I (institutional sponsorship) is what turns that repricing into actual buying pressure. A handful of retail investors buying on good earnings moves a stock a lot less than a fund managing billions building a position. Because large institutions move markets when they buy in size, they tend to accumulate over many days or weeks rather than all at once — and that behavior is exactly what shows up on the chart as the S (supply and demand) pattern: rising volume on up days, shrinking volume on down days.
L (leader status) filters for whether that buying pressure is concentrated in one name or spread evenly across a whole sector. Laggards with weak relative strength tend to respond less to the same good news, and O'Neil's reasoning was straightforward: there's little reason to own the second-best stock in a group when the leader is available.
M (market direction) is the single biggest variable that can override everything else. As covered in Lesson 20's Weinstein stage analysis, when the broader market is in a clear downtrend (Stage 4), individual stocks often get dragged down with the index regardless of how strong their own fundamentals look. O'Neil pointed out that historically, most of the market's biggest winners rose together with a broader market uptrend — and he advised judging market direction before spending time screening individual names.
Entry Timing: Bases and the Pivot Point
Where CANSLIM actually pulls the trigger isn't a financial-statement number — it's a chart pattern. The setup O'Neil referenced most often is the cup-and-handle, alongside variations like the double bottom and the flat base. What they share is a stock that rallies, then consolidates or pulls back for a period to form a "base," and the buy comes when price clears that base's resistance level (the pivot point) on rising volume.
This is, in effect, the same idea covered in Lesson 31's VCP (Volatility Contraction Pattern) — Mark Minervini, who formalized VCP, has said in multiple interviews that O'Neil's investing philosophy shaped his own approach heavily. The two differ mainly in sequencing: VCP is a purely technical method that enters based only on whether the price structure is tightening, while CANSLIM looks for the base breakout only within a shortlist of stocks that has already cleared the earnings, supply/demand, and market-direction filters first.
Stop-Loss and Sell Rules
O'Neil's headline rule is simple — if a position drops 7-8% from the buy price, sell it, no exceptions and no second-guessing. That figure is one of the most widely repeated conventions in CANSLIM circles, and the reasoning behind it is math: the deeper a loss gets, the faster the required recovery percentage grows.
| Loss | Gain needed to break even |
|---|---|
| -8% | +8.7% |
| -20% | +25% |
| -33% | +50% |
| -50% | +100% |
Profit-taking guidance gets discussed alongside it — the most common version is "consider taking some or all profit around a 20-25% gain," along with variants of an "8-week hold" rule for positions that rally hard and fast right out of the gate (often within 1-3 weeks of the breakout). O'Neil himself was clear that none of this is a fixed rule — it's a starting guideline that traders adjust to their own situation. It lines up with the logic from Lesson 6 on risk/reward and money management: keeping the stop tight at 7-8% means a system can still be profitable even with a win rate well under 50%.
A Worked Numeric Example (Simplified, Educational)
The numbers below are a simplified hypothetical example meant to illustrate the mechanics — not a real, backtested trade record.
| Item | Value | Note |
|---|---|---|
| Latest quarter EPS growth | +42% | Satisfies C (year-over-year) |
| 3-year average annual EPS growth | +28% | Satisfies A |
| Catalyst (N) | New product launch announced | Timed with the earnings surprise |
| Relative strength rank | Top 8% in its sector | Satisfies L |
| Institutional ownership trend | Rising for 2 consecutive quarters | Satisfies I |
| Market direction (M) | S&P 500 in a confirmed uptrend | Satisfies M |
| Base breakout price (pivot) | $52.00 | Top of an 8-week base |
| Entry | $52.60 | A small buffer above the pivot |
| Stop | $48.40 | -8% from entry |
| First profit target (convention) | $65.75 | +25% from entry |
Here, the stop distance is roughly 8%, and the reward-to-risk to the first target works out to about 3.1x (an "R multiple" of roughly 3.1R). When a stock only satisfies some of the seven factors — say, earnings look great but the broader market is in a downtrend — O'Neil himself recommended holding off on the entry rather than forcing it.
CANSLIM vs. VCP: What's the Difference
Both approaches treat "base breakout after a pullback" as the entry trigger, which is why they get mentioned together often — but they differ in scope.
| CANSLIM | VCP | |
|---|---|---|
| Scope of analysis | Financial statements (earnings) + supply/demand + chart pattern combined | Price and volume structure only |
| Stock selection | Only candidates that pass all 7 factors | Any stock showing a tightening pullback pattern |
| Market direction | A required checklist item (M) | A secondary factor traders reference separately |
| Entry signal | Pivot breakout from a base (e.g. cup and handle) | Pivot breakout after several successive contractions |
| Best suited for | Traders willing to also screen financial statements | Traders who want a fast, chart-pattern-only scan |
In practice, the two aren't usually treated as mutually exclusive — a common workflow is narrowing the universe with CANSLIM's earnings and supply/demand filters first, then using VCP or a cup-and-handle read to time the exact entry within that shortlist.
Limitations to Keep in Mind
- Bull-market bias: Since the M factor is itself built on requiring an uptrending market, stocks that satisfy the full checklist become scarce in a downtrend or sideways market — and forcing entries anyway tends to produce a string of stop-outs.
- Growth-stock bias: This is a framework for finding stocks with rapidly accelerating earnings, which doesn't line up well with a dividend or deep-value investing style.
- Confirmation lags price: The I (institutional buying) and L (leadership) factors are often only clearly confirmed after a stock has already run up significantly, which risks buying an already-extended move.
- Room for subjective judgment: A factor like N (something new) is hard to quantify objectively, so different investors can reasonably disagree on whether a stock satisfies it.
- Not a validated fixed formula: Numbers like 25%, 7-8%, and 20-25% are widely shared conventions from O'Neil's writing and the broader CANSLIM community — not statistically validated constants that hold across every market and every era.
FAQ
Is CANSLIM a short-term or long-term strategy?
It sits closer to swing-to-medium-term investing, typically holding for a period of weeks to months. It isn't a same-day strategy like day trading, but it also isn't the multi-year buy-and-hold style typical of dividend investing. Positions are held while the trend from the base breakout continues, and closed out once the stop-loss or profit-taking rule is triggered.
Can CANSLIM be applied outside the U.S. market?
The underlying logic isn't market-specific, but O'Neil's original research was built entirely on U.S. market data. Float sizes, how institutional ownership is disclosed, and how relative strength is typically calculated all vary by market — so applying CANSLIM elsewhere usually means adapting the underlying principles (earnings growth, supply/demand, leadership, market direction) rather than importing the exact numeric thresholds unchanged.
It's really hard to find a stock that satisfies all 7 factors — is it okay to act on just a few?
Stocks that cleanly satisfy all seven are genuinely rare. That said, O'Neil placed particular weight on C/A (earnings growth) and M (market direction) — and most practitioners advise against entering a trade that's missing those two, even if the other factors look fine. The remaining factors are more commonly treated as supporting evidence that adds conviction, not standalone triggers.
Summary
- CANSLIM is William O'Neil's 7-factor framework (C-A-N-S-L-I-M) for screening growth stocks, combining earnings growth, a fresh catalyst, supply/demand, leadership, institutional sponsorship, and market direction into a single checklist.
- The core mechanism: earnings growth (C, A) triggers analyst repricing, institutional buying (I) converts that repricing into real buying pressure, and market direction (M) can override everything else.
- Entry comes on a volume-confirmed pivot breakout from a base pattern like cup and handle; the best-known stop rule is a hard 7-8% loss from entry.
- CANSLIM shares roots with VCP but casts a wider net — folding in financial statements and supply/demand rather than reading price structure alone.
- Real limitations include a bull-market bias, a growth-stock bias, and confirmation that tends to lag price — so treat the specific numbers here as widely shared conventions, not validated absolutes.