Trading Strategies · Lesson 6/57 · 5 min read
Risk/Reward Ratio and Money Management
In this article
What Is Risk/Reward Ratio
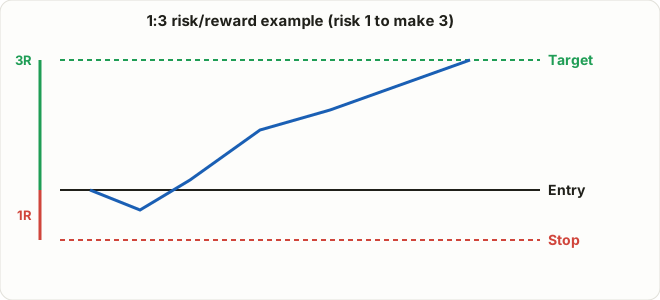
The Risk-Reward Ratio (R:R) is the ratio between how much you're risking on a trade and how much you stand to gain.
R:R = (Target - Entry) ÷ (Entry - Stop)
Example: entry at $50, stop at $48 (risking $2), target at $56 (potential gain of $6):
R:R = 6 ÷ 2 = 3 (i.e. "1:3")
"1:3" means "I'm risking 1 unit for a chance to make 3." This concept is the last piece of the puzzle that connects everything you've learned so far — moving average crossovers, momentum, mean reversion, breakouts, ICT — into trades that can actually make money over time.
Why Risk/Reward Can Matter More Than Win Rate
Beginner investors tend to focus only on "how often am I right" (win rate). But growing an account actually depends on win rate and risk/reward together.
Let's check this with the expectancy formula.
Expectancy = (Win rate × Average win) - (Loss rate × Average loss)
Example 1: High win rate, poor risk/reward
- 70% win rate, 1:0.5 risk/reward (win +1, lose -2)
- Expectancy = (0.7 × 1) - (0.3 × 2) = 0.7 - 0.6 = +0.1
Example 2: Low win rate, strong risk/reward
- 40% win rate, 1:3 risk/reward (win +3, lose -1)
- Expectancy = (0.4 × 3) - (0.6 × 1) = 1.2 - 0.6 = +0.6
Despite a much lower win rate (40% vs. 70%), the second example has an expectancy 6 times higher. "Being wrong 6 out of 10 times can still be profitable long-term, if your risk/reward is good enough" is the core insight here. This is exactly why many trend-following and breakout traders can be consistently profitable even with win rates around 40%.
⚠️ Conversely, poor risk/reward can erase an impressively high win rate. In Example 1, an expectancy of just +0.1 can easily flip negative once you factor in trading costs like commissions and slippage.
R-Multiples: Comparing Different Trades on Equal Footing
Knowing that "I made $300 on this trade" doesn't tell you much on its own — it matters a lot whether you risked $50 or $500 to make it. In practice, traders convert their P&L into "how many multiples of my initial risk did I make," recorded as R.
R-multiple = Actual P&L ÷ Initial risk (loss amount based on entry-to-stop distance)
- Risk $50, make $150 → +3R
- Risk $50, lose $50 (stopped out) → -1R
Recording trades in R lets you compare and analyze trades across different stocks and different risk amounts on the same scale. You end up with something objective, like "my average R over the last 20 trades was +0.4R," to track how well your strategy is actually performing.
Applying Risk/Reward in Practice
- Decide your stop and target before you enter (the same principle from the "Risk Management Basics" lesson).
- Set a minimum risk/reward threshold you require before taking a trade at all — many traders won't take a trade below, say, 1:1.5.
- Log every trade in R, so that over time you can see your strategy's actual win rate and average risk/reward from real data.
- If your average R stays negative over time, that's a signal to either improve your risk/reward (push targets further out, tighten stops) or tighten your entry criteria.
Risk/Reward and Win Rate Trade Off Against Each Other
A tighter stop improves your risk/reward, but it also tends to increase the odds of getting stopped out by noise (lowering your win rate). A wider stop can raise your win rate, but it worsens your risk/reward. There's no single correct answer — you have to design your stop placement and target together, balanced to fit your strategy and current market conditions.
MAE/MFE: Re-Validating Your Stop and Target With Data
If you want to sharpen your risk/reward in practice, it's worth logging Maximum Adverse Excursion (MAE) and Maximum Favorable Excursion (MFE) alongside your R-multiples.
- MAE: Regardless of how the trade eventually closed, the furthest it moved against you (in the losing direction) after entry
- MFE: The furthest it moved in your favor after entry
For example, say your stop is set at -2%, but looking back at the MAE of your winning trades, most of them never went past -0.5% before bouncing back. That could mean your stop is set too loosely, forcing you to take on more risk than necessary. Conversely, if trades you closed before reaching your target show an MFE that went well past your target before pulling back, that's a sign your target could have been set further out.
Building the habit of using your actual execution data to retroactively validate whether your stop and target placement were appropriate is the most practical way to keep refining gut-feel stop and target levels into something grounded in statistics.
Summary
Across this lesson and the ones before it, you've learned five strategies built on very different philosophies: moving average crossovers, momentum, mean reversion, support/resistance breakouts, and ICT smart money concepts. Whichever strategy you use, the risk/reward and money management principles from this lesson apply universally — finding good entry signals matters, but asking "is this trade statistically worth taking" every single time is what determines long-term survival.
💡 Whatever strategy you choose, it's worth backtesting it against historical data — checking the actual win rate and average risk/reward yourself — before committing real money. Rather than taking someone's claimed "this strategy has an X% win rate" at face value, verifying it yourself is always the safer habit.
In the next lesson, we'll turn the ICT concepts from the previous lesson into an actual trading checklist: the PO3 and Confirm DOL practical framework.