Trading Strategies · Lesson 91/91 · 9 min read
Single-Stock Covered Call ETFs (TSLY, NVDY): The Yield Trap Behind the Distribution Rate
In this article
- A 50% Distribution Rate — Too Good to Be True?
- The Structure: Where That Distribution Rate Actually Comes From
- The Secret Behind the Payout: Not Just Premium, Also "Return of Capital"
- Running the Numbers: Distribution Rate and Total Return Tell Different Stories
- Single-Stock Covered Call ETF vs. Running Your Own Wheel or PMCC
- The Tax Trap: How ROC Quietly Lowers Your Cost Basis
- A Checklist Before You Buy
- FAQ
- Summary
A 50% Distribution Rate — Too Good to Be True?
Scroll through a brokerage app and you'll find ETFs advertising annualized distribution rates of 40%, sometimes north of 80%. These are built on a single volatile stock — Tesla, Nvidia, MicroStrategy — and sell options against it to pay out cash monthly or even weekly. This is the single-stock covered call ETF, best known through the YieldMax lineup (TSLY, NVDY, MSTY, CONY, and similar), with comparable products now spreading fast outside the US as well. Through 2026, the gap between these headline payouts and what actually happens to an investor's account balance has become a recurring topic in both English-language financial media and Korean coverage — to the point that Korea's financial regulator took the unusual step of publicly warning that a distribution rate is not a guaranteed return. This lesson breaks down exactly how that number gets so high, and why it's a fundamentally different question from the total return you actually end up with.
Lesson 27's wheel strategy and Lesson 61's poor man's covered call (PMCC) are both DIY approaches where you personally sell the options and collect the premium. A single-stock covered call ETF starts from the same basic idea — but has the fund manager execute it for you as a packaged product — yet the structure and the risk it carries differ more than that similarity suggests. Treat "high distribution rate" as automatically good without understanding the mechanism, and you can end up collecting steady cash payouts while the overall value of your position quietly erodes underneath you.
The Structure: Where That Distribution Rate Actually Comes From
Most single-stock covered call ETFs aren't a simple covered call where the fund just holds the stock and sells calls against it. A large share of these products instead build synthetic long exposure — buying a call and selling a put to replicate owning the stock — rather than holding actual shares, then layer a short-dated (often weekly) call on top of that synthetic position to generate premium. Why weekly rather than monthly? An option's time value (theta) decays faster the closer it gets to expiration, so selling four weekly options back-to-back tends to collect more cumulative premium than selling one monthly option covering the same stretch. And because the underlying stocks — Tesla, Nvidia — carry high implied volatility, the options written against them are already expensive, which is the structural reason the headline distribution rate looks so large in the first place.
The Secret Behind the Payout: Not Just Premium, Also "Return of Capital"
Here's the part that matters most: not every dollar of a monthly distribution is option premium the fund actually earned that period. Issuers themselves disclose — often through dedicated "ROC Center" pages — that a meaningful share of each distribution is classified as return of capital (ROC). In plain terms, ROC means the fund isn't handing you profit; it's handing back a slice of your own original investment. You don't owe tax on it when you receive it, but each ROC payment lowers the cost basis of your shares by that amount.
This is exactly why the headline rate can be misleading if you don't look closer: the issuer can blend "premium income that's reasonably sustainable" with "a return of your own capital" into one combined distribution-rate figure. The rate itself isn't fabricated — it's a real number based on cash actually paid out. The problem is treating it as if the entire amount represents money earned on top of your investment, when part of it is simply your own principal coming back to you. That distinction is the first place where the distribution rate and total return start to diverge.
Running the Numbers: Distribution Rate and Total Return Tell Different Stories
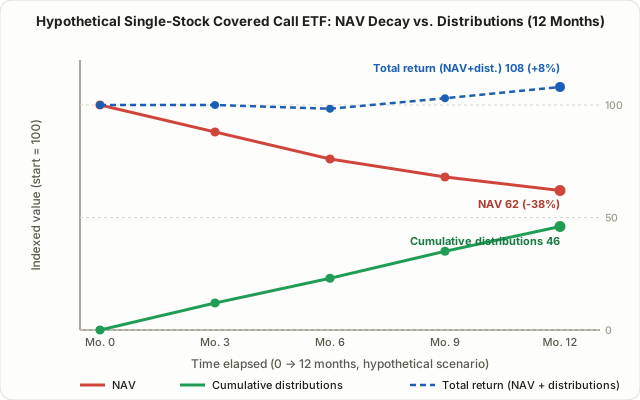
A simplified hypothetical example makes the mechanism concrete. The figures below are not a real product's historical performance — they're a deliberately simplified illustration of the structural pattern.
| Period | Underlying stock (volatile single name) | ETF NAV | Quarterly distribution | Cumulative distributions |
|---|---|---|---|---|
| Month 0 | 100 | 100 | — | 0 |
| Month 3 | 108 (+8%) | 88 | 12 | 12 |
| Month 6 | 95 (−12% cumulative) | 76 | 11 | 23 |
| Month 9 | 102 (+2% cumulative) | 68 | 12 | 35 |
| Month 12 | 90 (−10% cumulative) | 62 | 11 | 46 |
In this scenario, the underlying stock finishes the year down a modest 10%. The ETF's NAV, though, falls from 100 to 62 — a 38% decline. Where does that gap come from? Because the fund keeps selling calls, most of the upside during the rallying stretches gets capped off and never flows through to NAV, while the losses during the down stretches pass through almost in full. That asymmetric payoff — upside capped, downside largely exposed — repeats every period and steadily grinds the NAV lower.
Over the same 12 months, cumulative distributions add up to 46. Combine the NAV decline (−38) with the distributions (+46) and the total return comes out to roughly +8% for the year. Looking only at the distribution rate — "11 to 12 per quarter, consistently" — might feel like a 40%+ annualized return, but the actual total return is far smaller. This is the mechanism behind what's commonly called the yield trap: the distribution rate is calculated against NAV at the moment of payment, and it says nothing about the fact that the NAV itself keeps shrinking underneath it.
Single-Stock Covered Call ETF vs. Running Your Own Wheel or PMCC
Set this side by side with Lesson 27's wheel strategy and Lesson 61's PMCC, and the structural differences stand out clearly.
| Single-stock covered call ETF | Self-run wheel / PMCC | |
|---|---|---|
| Position construction | Fund manager runs synthetic long + short call automatically | You personally hold shares or LEAPS and sell the call |
| Choice of strike/expiration | None — set by the fund's own algorithm | You choose, and can adjust as conditions change |
| Visibility into the payout mix | Depends on issuer disclosure (ROC percentage, etc.) | You track your own premium collected directly |
| Tax handling | Cost-basis adjustments from ROC, often complex by jurisdiction | Comparatively simpler — taxed as option gains |
| Accessibility | Buy one ticker in a regular brokerage account | Requires options approval and ongoing rolling |
| Downside exposure | Often close to fully exposed given the synthetic structure | Full exposure to the shares you hold, but you control the structure |
The core distinction is who's making the decisions. Running your own wheel or PMCC, you adjust strikes and expirations as the situation changes. With a single-stock covered call ETF, every one of those decisions is locked into a predetermined algorithm ahead of time. In exchange, you get real convenience — no options approval, no rolling, just buy one ticker — but without looking under the hood, you're fully exposed to the yield trap described above.
The Tax Trap: How ROC Quietly Lowers Your Cost Basis
ROC not being taxed when received can sound like "tax-free income," but it's closer to tax deferral than tax avoidance. Each ROC payment lowers your cost basis in the shares, and once that cost basis hits zero, any further ROC received from that point on is taxed as a capital gain. On top of that, when you eventually sell, your gain or loss is calculated against that now-lower cost basis — so money that felt tax-free when you received it as a distribution can come back as a larger taxable gain at the point of sale. Exact treatment varies significantly by country and account type (taxable brokerage vs. tax-advantaged retirement account), so check the issuer's distribution breakdown and consult a tax professional before buying in.
A Checklist Before You Buy
- Look at total return (NAV change plus distributions), not the distribution rate. Compare the total-return figure that the issuer or a data provider publishes side by side with the headline rate — that's where the real performance shows up.
- Check the ROC percentage in the distribution breakdown. A higher ROC share means more of the payout is your own capital coming back, not new income earned.
- Compare the expense ratio. Single-stock covered call ETFs often carry meaningfully higher fees than a plain index fund, and that cost compounds over a long holding period.
- Evaluate the underlying stock's volatility first. The more the underlying swings, the bigger the premium collected from selling calls — but also the bigger the NAV damage during drawdowns. As in Lesson 72's leveraged ETF volatility decay, the variable that matters here is volatility, not direction.
- Decide upfront whether you want income or total return. If near-term cash flow is the goal, the distribution rate itself carries real meaning. If the goal is growing your overall capital, total return is the number that actually matters.
FAQ
Does a high distribution rate mean the fund is misrepresenting its numbers?
No. The distribution rate itself is a factual figure based on cash the issuer actually paid out. The issue is that a meaningful share of it can be return of capital, and the rate alone doesn't show the NAV eroding alongside it. It's not fabrication — it's a number with a narrower scope than it appears to have.
Does every single-stock covered call ETF always suffer NAV decay?
Not necessarily. When the underlying stock climbs steadily with low volatility, the call premium collected may be smaller, but so is the NAV damage. When the underlying swings sharply or trends down hard, decay tends to show up clearly and gets widely reported. The point isn't that any specific product is doomed — it's that the outcome depends heavily on the underlying's volatility regime at the time.
If I still want exposure, how should I approach it?
Start with the checklist above: check total return rather than the distribution rate, and look directly at the ROC percentage and expense ratio in the fund's own disclosures. Beyond that, it's commonly suggested to size the position as a small slice of a portfolio used specifically for income, with a clear understanding that this is a tool for cashing out premium on a volatile stock — not a long-term wealth-building vehicle.
Summary
- Single-stock covered call ETFs build synthetic exposure to one volatile stock and sell short-dated calls against it, which is what produces the high headline distribution rate.
- A meaningful share of each distribution can be classified as return of capital rather than realized income — untaxed on receipt, but it lowers your cost basis and defers rather than eliminates the eventual tax.
- The capped-upside, largely-exposed-downside structure from selling calls repeatedly tends to produce NAV decay even while distributions keep flowing — a pattern commonly described as the yield trap.
- Unlike Lesson 27's wheel strategy or Lesson 61's PMCC, the fund's algorithm — not you — controls strike and expiration selection, which is the biggest structural difference.
- Before buying in, check total return, the ROC percentage, the expense ratio, and the underlying's volatility — not just the distribution rate — to avoid falling into the yield trap.