Trading Strategies · Lesson 90/90 · 9 min read
Volume Spread Analysis (VSA): Reading No Demand, No Supply, and Upthrust Bars
In this article
Weighing a Bar's Effort Against Its Result
Volume Spread Analysis (VSA) reads a single bar's spread (its high-to-low range), where its close sits within that range, and its volume, to judge whether buyers or sellers were really in control of that bar. Lesson 16's order flow analysis needed tick-level data tagged with aggressor side (footprint charts, Cumulative Volume Delta); VSA asks a similar question using nothing more than ordinary OHLCV (open, high, low, close, volume) data that almost every free charting platform already provides. The method was systematized and popularized by trader Tom Williams in the 1990s, and terms like "no demand bar" and "stopping volume" still show up regularly in TradingView custom indicators and trading-education content today.
VSA's roots trace back to the Law of Effort vs. Result covered in Lesson 21's Wyckoff material. Wyckoff applied that law to a multi-week accumulation or distribution schematic — a big-picture question of which phase a range is currently in. VSA applies the identical law to a single bar, in real time, as each bar closes: does this bar's volume (effort) line up with how far price actually moved and where it closed (result), or is there a mismatch? VSA isn't a replacement for the Wyckoff schematic; it's closer to a magnifying glass for reading the individual events inside it at a finer resolution.
Four Core Bar Patterns
These are the four bar types VSA practitioners cite most often. The thresholds below are commonly cited conventions, not a fixed industry standard — the exact volume multiple or lookback window varies by platform and trader.
| Pattern | Direction | Spread | Volume | Reading |
|---|---|---|---|---|
| No Demand | Up close | Narrow (smaller than the prior bar) | Lower than each of the prior two bars | Price rose, but with too little buying behind it — a warning of a stalling rally |
| No Supply | Down close | Narrow | Lower than each of the prior two bars | Price fell, but with too little selling behind it — supply drying up |
| Stopping Volume | Down close, wide spread | Wide | Noticeably above average (often 2x or more, by convention) | Close sits mid-to-high in the range, not near the low — buying absorbed the selling |
| Upthrust | New high, then closes lower | Wide, or a long upper wick | Above average | Price pokes above the prior high but closes back below the open or the bar's midpoint — late buyers get sold into |
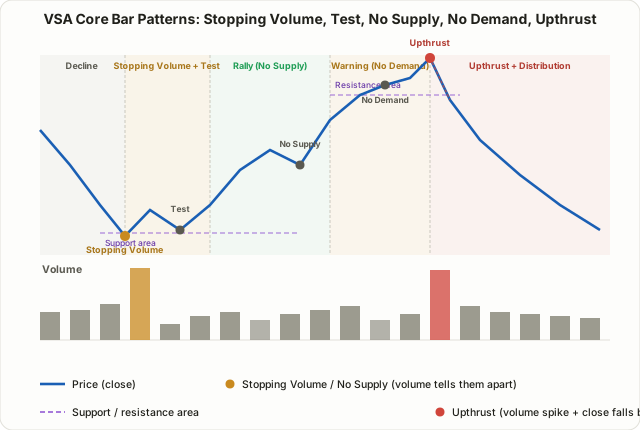
A No Demand bar shows up during a rally, or near the top of a range, as an up-closing bar whose volume has visibly fallen off relative to the prior two bars. Price went up, but not enough fresh buying showed up to drive it — read as a sign that new buyers aren't stepping in anymore, especially if it appears after the move has already run for a while. A No Supply bar is the mirror image: a down-closing bar on shrinking volume, read as sellers running out of ammunition, usually noted near the tail end of a downtrend or during a shallow pullback inside an uptrend.
Stopping Volume is the one that looks the scariest on first glance — a wide-range down bar on a volume spike. But the whole point of VSA is to check where the close actually landed. If that much volume (effort) produced a close sitting mid-to-high in the bar's range rather than near the low (result), the effort and result don't match: something absorbed the selling pressure and pushed price back up within the same bar. It's functionally the single-bar version of the Wyckoff Selling Climax from Lesson 21. Upthrust is the mirror image at the top: price tags a fresh high, drawing in late buyers, then closes back below the open or the bar's midpoint — read as that same volume being used to distribute shares into the buying rather than to hold the breakout.
The Test Bar and the Confirmation Step
Just as a Wyckoff Spring is typically followed by a Test, VSA practitioners usually want to see a Test bar confirm a Stopping Volume or No Supply bar before treating it as reliable. A Test bar revisits the prior low on volume that's noticeably lighter than the bar that made that low. A quiet retest on thin volume leans toward selling pressure genuinely being exhausted; if the retest still comes on heavy volume, supply is likely still present. Among VSA practitioners, a common convention is to treat a two-step sequence — Stopping Volume (or No Supply) followed by a lighter-volume Test — as more reliable than either signal taken alone.
A Worked Example
Assume daily bars for stock G, where the 20-day average volume is 1.0 million shares.
| Day | Open | High | Low | Close | Volume | Reading |
|---|---|---|---|---|---|---|
| D1 | $14.20 | $14.30 | $13.50 | $14.05 | 2.65M | Stopping Volume — wide spread, 2.65x average volume, close sits 69% up the bar's range |
| D2 | $14.05 | $14.15 | $13.90 | $14.00 | 0.55M | Test — doesn't revisit D1's low, and volume drops to 0.55x average |
| D3 | $14.00 | $14.45 | $13.98 | $14.40 | 1.40M | Ordinary up day, average volume |
| D4 | $14.40 | $14.52 | $14.25 | $14.28 | 0.48M | No Supply — down close, narrow spread, volume at just 0.48x average |
| D5 | $14.28 | $14.75 | $14.26 | $14.70 | 1.80M | Breakout on above-average volume, a Sign of Strength |
D1 looks alarming in isolation — a sharp drop on a volume spike — but the close at $14.05 sits roughly 69% of the way up the $13.50–$14.30 range, not near the low. That's a mismatch between the effort (2.65M shares) and the result (how far the close actually settled). D2 satisfies the Test condition: the low isn't revisited, and volume drops to about half the average. D4's No Supply bar comes after D3's rally and reads as a shallow, low-conviction pause rather than fresh selling, given volume under half the average — consistent with the volume-backed follow-through that shows up on D5. This is a five-bar illustrative scenario, though, and real charts rarely line up this cleanly in sequence.
VSA vs. Order Flow (CVD): Same Question, Different Raw Material
Lesson 16's order flow trading and VSA are really answering the same question — who's winning at this price, buyers or sellers? — with different raw material.
| VSA | Order Flow (Footprint/CVD) | |
|---|---|---|
| Data needed | Bar-level OHLCV (open, high, low, close, volume) | Tick-level trade data tagged by aggressor side |
| Accessibility | Free on most charting platforms | Usually requires a specialized platform or paid feed |
| Unit of analysis | One completed bar, after the fact | The bar as it's forming, tick by tick |
| Core evidence | Spread + close location + volume, combined | Buy volume minus sell volume (delta) |
| Signature signals | No Demand, No Supply, Stopping Volume, Upthrust | Delta divergence, stacked imbalance |
If order flow is the microscope, VSA is closer to a widely accessible magnifying glass: it reaches a similar conclusion about who's in control without needing aggressor-tagged tick data, which is why it's stayed in wide use decades after it was first popularized. The tradeoff is that VSA can only be read once a bar has fully closed, so it isn't as real-time as order flow. Where both are available, a workable combination is using VSA on daily or hourly bars to filter the bigger picture, then narrowing entry timing with order flow on a shorter, tick-accessible timeframe.
Limitations
- Volume thresholds are relative, not absolute. "Low" or "high" volume is judged against the prior few bars or a moving average, not a fixed number. The lookback window (2 bars, 10, 20) varies by trader, and there's no single industry standard.
- Spread width and close location involve judgment. Where "narrow" ends and where a close counts as being in the "upper" versus "middle" of the range are read by eye more than by a hard numeric rule.
- Thin, choppy volume distorts the signals. In illiquid names, a single large order can produce a convincing-looking No Demand or No Supply bar that has nothing to do with genuine accumulation or distribution.
- Context matters more than any single bar. The same No Demand bar means something different early in a downtrend than it does near the top of an extended rally. It's generally read alongside support/resistance, the prevailing trend, and where price sits within a larger Wyckoff schematic from Lesson 21.
- This is an empirical framework, not a statistically validated edge. Tom Williams never published formal backtest results for VSA; its track record rests on decades of practitioner observation rather than peer-reviewed testing.
FAQ
Is VSA just a rebrand of the Wyckoff method?
Not quite a rebrand — more a bar-by-bar operationalization of one specific Wyckoff law. Lesson 21's Spring and Upthrust are events inside a schematic that can take weeks to play out; VSA's same-named patterns are smaller-scale events you check for, in principle, on every single bar.
What timeframe works best for VSA?
Many practitioners find signals more reliable on daily and 4-hour bars than on short intraday timeframes, where noise tends to produce frequent, lower-quality No Demand and No Supply readings.
Is one No Demand bar enough to sell?
Not generally recommended. As with the Test bar sequence described above, a single VSA signal is typically treated as a flag to watch rather than an entry trigger on its own, pending confirmation from the following bars' volume or a break of support/resistance.
Summary
- VSA reads buyer-seller strength from three ingredients of a single bar — spread, close location, and volume — as a bar-by-bar application of Wyckoff's Law of Effort vs. Result.
- The four core patterns are No Demand (weak buying), No Supply (weak selling), Stopping Volume (selling absorbed), and Upthrust (buying drawn in, then distributed).
- A Stopping Volume or No Supply bar is generally considered more reliable once a lighter-volume Test bar confirms it.
- VSA and order flow (CVD) ask a similar question, but VSA's main advantage is accessibility — it works on ordinary OHLCV data without needing tick-level feeds.
- Because volume thresholds and spread width involve relative, subjective judgment, treat VSA signals as context for trend and support/resistance analysis rather than standalone triggers.