Trading Strategies · Lesson 99/99 · 10 min read
Bitcoin ETF Flow Trading: Reading IBIT, FBTC, and GBTC Net Inflows as a Sentiment Signal
In this article
- A New Flow-of-Funds Signal Since January 2024
- Creation and Redemption: Where the Flow Number Comes From
- Premium/Discount to NAV: The Mechanism That Drives Flow
- Comparing Issuers: Aggregate Flow Hides the Real Story
- Does Flow Predict Price, or Just Confirm It?
- A Practical Checklist for Using Flow Data
- A Worked Example
- Limits and Caveats
- FAQ
- Summary
A New Flow-of-Funds Signal Since January 2024
Since the SEC approved the first spot Bitcoin ETFs in January 2024, a new dataset has become part of daily crypto trading discussion: how many dollars moved into or out of funds like BlackRock's IBIT, Fidelity's FBTC, and Grayscale's GBTC overnight. Trackers such as Farside Investors and SoSoValue publish this net flow figure every trading day, and financial media now treats an "11 straight days of inflows" or a "$4.5 billion outflow month" as a headline-worthy event on its own. This lesson covers what ETF net flow actually measures, how the creation/redemption mechanism behind it works, how to compare flows across issuers, and — just as importantly — why the data tends to confirm what price already did more often than it predicts what price will do next. It's a flow-of-funds signal in the same family as 13F superinvestor tracking (Lesson 70) and on-chain MVRV/SOPR (Lesson 67), but built from an entirely different data source: regulated fund flows instead of blockchain ledgers or quarterly filings.
Creation and Redemption: Where the Flow Number Comes From
A spot Bitcoin ETF isn't a pool of cash that an issuer actively trades. Shares are created and destroyed through a mechanism involving authorized participants (APs) — large broker-dealers who are the only entities allowed to deal directly with the fund:
- An AP who wants more ETF shares to sell to the public delivers bitcoin (or, under the cash model some funds still use, cash that the issuer converts to bitcoin) to the fund.
- The fund issues new ETF shares in return — this is a creation, and it shows up as a net inflow.
- When an AP redeems ETF shares instead, the fund hands back bitcoin (or sells bitcoin to raise cash) and cancels the shares — this is a redemption, and it shows up as a net outflow.
Net flow for a given day is simply:
Net flow = dollar value of shares created − dollar value of shares redeemed
This number is a byproduct of an arbitrage mechanism, not a direct measure of retail sentiment. APs create or redeem shares because the ETF's market price has drifted away from its net asset value (NAV), and doing so is profitable — not because they're voting on Bitcoin's future. That distinction matters for how much weight to put on the number, which this lesson comes back to below.
Premium/Discount to NAV: The Mechanism That Drives Flow
The reason creation and redemption happen at all is the relationship between an ETF's market price and its NAV:
Premium or discount (%) = (Market price − NAV) ÷ NAV
If the ETF trades at a premium (above NAV), APs can profit by delivering bitcoin to create cheap shares and selling them into the market at the higher price — pushing flow positive. If it trades at a discount (below NAV), the reverse trade — buying cheap shares, redeeming them for bitcoin worth more — pushes flow negative. In a healthy, liquid ETF this arbitrage keeps the gap to a few basis points, closing almost as soon as it opens.
GBTC is the textbook case of what happens when that arbitrage mechanism is absent. Before converting to an open-end ETF in January 2024, GBTC was a closed-end trust with no redemption mechanism at all. It traded at a large premium to NAV during the 2020–2021 bull run, then flipped into a persistent double-digit discount through 2022–2023 as that trust structure's defect became obvious — investors wanting out had no way to redeem at NAV and could only sell into the market below it. Once conversion to an ETF restored the creation/redemption mechanism, that structural discount disappeared, but GBTC has since been the single biggest source of outflows among the spot funds anyway, driven by a separate factor: its 1.5% expense ratio, multiples higher than IBIT's or FBTC's. Investors used GBTC's vehicle while it was the only option, then redeemed out of it into cheaper competitors once those launched.
Comparing Issuers: Aggregate Flow Hides the Real Story
A single headline number — "spot Bitcoin ETFs saw $118 million in net inflows today" — can be misleading on its own, because it's a sum across issuers with very different flow behavior. The table below summarizes the pattern that's shown up repeatedly since 2024:
| Fund | Typical flow behavior | Why |
|---|---|---|
| IBIT (BlackRock) | Largest cumulative net inflows of any fund by a wide margin | Low 0.25% fee, BlackRock distribution reach, became the default "Bitcoin ETF" for most new allocators |
| FBTC (Fidelity) | Second-largest, generally mirrors IBIT's direction | Also low-fee, strong existing Fidelity brokerage distribution |
| GBTC (Grayscale) | Persistent net outflows even in up markets | 1.5% fee drives a slow bleed as holders switch to cheaper funds; a legacy of the old high-premium/high-discount trust years |
| Smaller/mini funds (ARKB, BITB, Grayscale Mini Trust, etc.) | Small, inconsistent flows | Lower AUM and distribution reach than the top two |
Because of this split, a day where the aggregate reads "flat" can actually mean IBIT and FBTC took in new money while GBTC bled out an offsetting amount — two very different stories netting to zero. Reading issuer-level flow, not just the headline total, is necessary to tell which story is actually happening.
Does Flow Predict Price, or Just Confirm It?
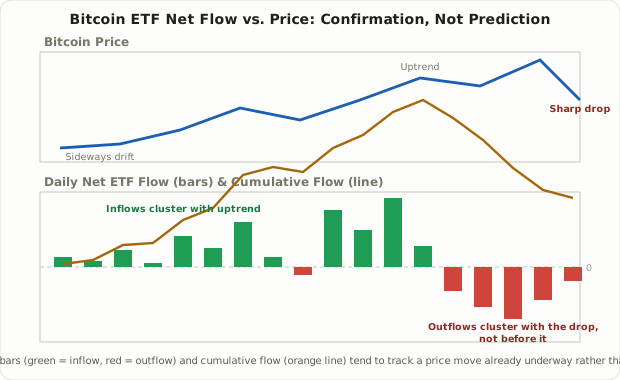
This is the part of the story that gets skipped in most flow-chasing takes. A widely cited 2024 analysis from crypto market maker DWF Labs found that across eight separate occasions when Bitcoin fell more than 15% after the spot ETFs launched, seven of them coincided with net ETF outflows, not inflows. In other words, when price fell hard, money tended to be leaving the ETFs at the same time — the opposite of what you'd expect if outflows were a leading indicator that could be bought ahead of a bounce. Bloomberg ETF analyst Eric Balchunas has repeatedly cautioned traders not to overreact emotionally to single-day flow figures, noting that daily flow is small relative to total assets under management and gets noisy in both directions.
Some independent analyses of the data go further and estimate that a meaningful share of flow-driven price moves — commentary citing figures in the ballpark of a third or more — tend to partially reverse within about a week. Treat any such specific percentage as an illustrative finding from one piece of research, not an established constant; the exact number will vary by period and methodology. The more defensible, general takeaway is this: ETF flow behaves far more like a lagging confirmation of a move that's already underway than a signal that leads price. That doesn't make it worthless — it means the right question to ask isn't "did flow just turn positive, so should I buy," but "does flow line up with the trend I'm already seeing in price, volume, and other context."
A Practical Checklist for Using Flow Data
- Use cumulative flow, not one day. A single day's number is noisy. A 7-day or 30-day cumulative flow trend filters out day-to-day arbitrage mechanics and reveals the underlying trend more reliably.
- Split by issuer before reading the aggregate. As shown above, netting IBIT/FBTC inflows against GBTC outflows can disguise what's actually happening.
- Watch for divergence from price, not confirmation of it. The more interesting signal is when flow and price trend disagree — for example, price grinding sideways to slightly down while cumulative flow stays strongly positive — rather than flow simply mirroring a move that's already obvious on the chart.
- Factor in the quarter-end effect. Some analysts have noted flows tend to tick up around calendar quarter-end, plausibly tied to institutional rebalancing cycles. Treat this as a loose seasonal tendency to be aware of, not a hard rule to trade on.
- Never treat it as a standalone trigger. Given the lagging, reactive tendency documented above, flow data works best as one confirming input alongside trend structure, volatility context, and your existing risk plan — not as the reason to enter or exit a position by itself.
A Worked Example
Suppose Bitcoin has been in a six-week uptrend, up about 20% from its recent low. Over that same window, Farside's tracker shows cumulative net flow across all spot ETFs of +$2.1 billion, with IBIT alone contributing +$1.8 billion and GBTC showing a modest -$300 million (consistent with its ongoing fee-driven bleed rather than a new signal). Reading this set of numbers together: the inflow is broad and issuer-concentrated in the lowest-fee fund, which is the pattern associated with genuine new institutional allocation rather than a one-off trade; the GBTC outflow is explainable by its known structural bleed and doesn't need to be read as bearish; and because the flow is tracking a trend that's already visible on the price chart, it functions here as confirmation of the existing uptrend rather than as an independent reason to act. If, instead, that same strong cumulative inflow showed up while price had been flat or drifting down for two weeks, that divergence — flow rising while price lags — would be the more notable, less commonly discussed signal worth paying attention to.
Limits and Caveats
- The flow number is a byproduct of arbitrage, not a sentiment poll. It's generated by APs responding to premium/discount gaps, not a direct survey of what retail or institutional holders believe about Bitcoin's future.
- Daily data is noisy and small relative to AUM. As Balchunas has pointed out, treating single-day swings as major news tends to overstate their importance.
- The data skews reactive. The DWF Labs finding on outflows coinciding with sharp drawdowns, more often than leading them, is a meaningful caution against using outflows as a standalone "buy the dip" trigger.
- In-kind vs. cash creation can matter at the margin. Some funds moved from cash-only to in-kind creation/redemption after mid-2025 regulatory changes, which can affect settlement speed and the tax/cost profile of the arbitrage trade, though it doesn't change the basic flow interpretation covered here.
- Not a replacement for on-chain or derivatives data. Flow tells you about regulated-fund demand specifically. It says nothing about leveraged futures positioning (see liquidation heatmap trading, Lesson 64) or the underlying blockchain's realized profit/loss state (Lesson 67).
FAQ
Is a day of heavy ETF outflows a buying opportunity?
Not reliably, and the historical pattern actually argues the opposite in sharp selloffs: a widely cited analysis found outflows coincided with most of the largest post-launch drawdowns, rather than preceding bounces. Treat heavy single-day outflows as confirmation that selling pressure exists, not as a standalone contrarian buy signal.
Why does GBTC keep bleeding money even when Bitcoin is rallying?
Mostly its fee. At roughly 1.5% versus IBIT's or FBTC's roughly 0.25%, long-term holders have strong reason to switch funds regardless of where price is heading, so GBTC's outflow trend is often a fee-migration story rather than a bearish signal about Bitcoin itself.
Where can I actually check this data myself?
Farside Investors and SoSoValue both publish daily and cumulative spot Bitcoin ETF flow tables broken out by issuer, which is the level of detail (cumulative, by fund) this lesson recommends over a single aggregated daily headline.
Summary
- Spot Bitcoin ETF net flow measures the dollar value of shares created minus shares redeemed each day, driven by authorized participants arbitraging gaps between the ETF's market price and its NAV.
- GBTC's history — a closed-end trust with a large premium, then a deep discount, before converting to an ETF in 2024 — is the clearest illustration of why the creation/redemption mechanism matters; its ongoing outflows since then are mainly a fee story, not a bearish signal.
- Reading issuer-level flow (IBIT and FBTC vs. GBTC) matters more than the single aggregate number, which can net out two opposite stories into a misleadingly flat headline.
- Multiple independent observations — the DWF Labs drawdown study and Bloomberg's Eric Balchunas on daily noise — point the same direction: flow tends to confirm a move already in progress more than it predicts the next one.
- Used well, ETF flow is a cumulative, issuer-split confirmation tool to weigh alongside price trend and other context — not a standalone entry or exit trigger.