Trading Strategies · Lesson 67/67 · 9 min read
On-Chain Analysis Trading: Reading Bitcoin Cycle Tops and Bottoms with MVRV Z-Score and SOPR
In this article
- Reading the Blockchain Ledger Instead of the Price Chart
- Realized Cap: The Foundation Underneath Both Metrics
- MVRV and the MVRV Z-Score: Aggregate Profit Across All Holders
- SOPR: Were the Coins That Moved Today Sold at a Profit or a Loss?
- MVRV vs. SOPR: Same Underlying Question, Different Time Horizons
- Exchange Netflow: A Third Confirming Signal
- A Worked Example
- Limits and Caveats
- FAQ
- Summary
Reading the Blockchain Ledger Instead of the Price Chart
Almost every indicator covered so far in this course is built from price, volume, or exchange-supplied derivatives data — Lesson 62 on funding rates and Lesson 64 on liquidation heatmaps both fall in that bucket. On-chain analysis works from an entirely different data source. A public blockchain like Bitcoin's permanently records the price at which every coin last moved, which means anyone can query that public ledger directly and ask questions like "is the average holder sitting on a profit or a loss right now?" or "were the coins that moved on-chain today sold at a gain or a loss?" That's the core idea behind on-chain analysis. Platforms like Glassnode and CryptoQuant have made this data mainstream enough that MVRV and SOPR now show up constantly in crypto trading discussion. This lesson covers what each metric actually calculates, why they tend to behave in recognizable ways near cycle extremes, and how exchange netflow rounds out the picture as a third confirming signal.
Realized Cap: The Foundation Underneath Both Metrics
Understanding MVRV and SOPR starts with realized cap. Ordinary market cap is "current circulating supply × current price," which implicitly assumes every coin in existence trades at today's price. Realized cap instead values each coin at the price it last moved on-chain. If a coin moved into a wallet three years ago at $20,000 and hasn't moved since, it still counts as $20,000 in the realized cap calculation, regardless of today's price. This approximates the aggregate cost basis of the market — a rough estimate of what holders actually paid, on average, for the coins they're sitting on.
That comparison — current market value against this cost-basis proxy — is what both MVRV and SOPR build on, just from two different angles.
MVRV and the MVRV Z-Score: Aggregate Profit Across All Holders
MVRV (Market Value to Realized Value) is simply market cap divided by realized cap:
MVRV = Market Cap ÷ Realized Cap
An MVRV above 1 means the market as a whole is sitting on an unrealized profit; below 1 means an aggregate unrealized loss. The raw ratio's absolute level tends to drift as the market matures, so in practice traders more often use the MVRV Z-Score, which normalizes it:
MVRV Z-Score = (Market Cap − Realized Cap) ÷ standard deviation of Market Cap
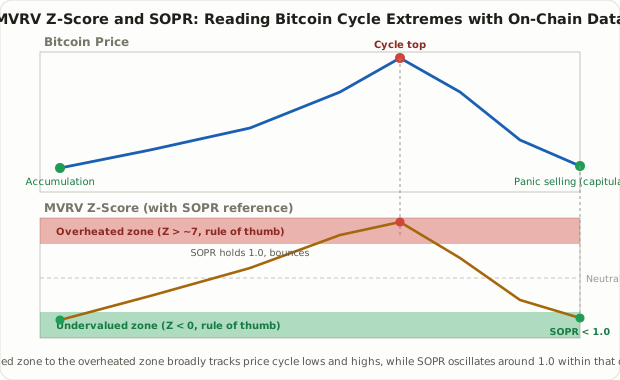
Dividing the gap between market cap and realized cap by historical volatility puts the current reading on a single scale that's comparable across time. The commonly cited rule-of-thumb bands look like this — worth stressing up front that these are patterns observed across past cycles, not guarantees the same numbers will repeat going forward.
| MVRV Z-Score range | Common reading | Historical observation |
|---|---|---|
| Below 0 (green zone) | Market as a whole is at an aggregate loss | Recurred near the 2015, 2018–19, and 2022 bottoms |
| 0 to 3 | Neutral to recovery | Often seen once a bottom has passed and an uptrend begins |
| 3 to 7 | Approaching overheated | Late-stage rally, more frequent pullbacks |
| Above 7 (red zone) | Market as a whole at extreme aggregate profit | Observed near the 2013, 2017, and 2021 cycle peaks |
Treat those thresholds as context, not law. The 2021 cycle peak's Z-Score, for instance, came in lower than 2017's — a pattern many analysts attribute to the market growing larger and the share of long-term holders increasing, which pushes realized cap up faster alongside price. In other words, as the market matures, the same underlying degree of "overheated" can show up at a lower Z-Score than it used to, which means the exact thresholds deserve re-reading over time rather than treatment as fixed.
SOPR: Were the Coins That Moved Today Sold at a Profit or a Loss?
Where MVRV looks at every coin in existence, SOPR (Spent Output Profit Ratio) looks only at the coins that actually moved on-chain today:
SOPR = sale price of moved coins ÷ price when those coins last moved
A SOPR above 1 means coins moving on-chain today were sold, on average, at a profit; below 1 means at a loss. The level traders watch most closely is the SOPR = 1.0 line. During uptrends, when a pullback pushes SOPR down toward 1.0, holders often become reluctant to sell at a loss, and selling pressure dries up right around that level — SOPR touches 1.0 repeatedly without breaking meaningfully below it, then bounces. Analysts commonly describe this as "SOPR defending 1.0 like support." The opposite pattern — SOPR breaking clearly below 1.0 and staying there — tends to show up during downtrends, and is read as a sign that holder psychology has broken enough that people are willing to realize losses rather than hold.
MVRV vs. SOPR: Same Underlying Question, Different Time Horizons
The two metrics get mentioned together constantly, but they're built to answer different questions, not to compete with each other.
| MVRV (Z-Score) | SOPR | |
|---|---|---|
| Scope | Every coin in existence, including ones that never moved | Only coins that actually moved today |
| Nature | Aggregate unrealized (paper) profit/loss | Realized (confirmed) profit/loss |
| Time horizon | Positions the market within a full cycle (months to years) | Tracks daily shifts in selling pressure (days to weeks) |
| Typical use | "Are we near a cycle low or a cycle high?" | "Is today's pullback profit-taking or panic?" |
| Responsiveness | Slow, smooth curve | Fast, noisy day to day |
In practice, the two are usually read together rather than in isolation. If the MVRV Z-Score is sitting in the undervalued zone while SOPR keeps bouncing off 1.0, that's two different time horizons pointing at the same conclusion — a cyclical low with fading loss-driven selling. If the Z-Score is in the overheated zone while SOPR spikes sharply, that reads more like long-term holders actually cashing in large realized gains.
Exchange Netflow: A Third Confirming Signal
MVRV and SOPR both measure holders' profit or loss. Exchange netflow measures something different — where coins are physically moving:
Exchange netflow = coins deposited to exchanges − coins withdrawn from exchanges
A sustained negative netflow (withdrawals outpacing deposits) is widely read as holders moving coins into private or cold storage — a signal they're not planning to sell soon. A netflow that turns positive, with exchange balances rising, is often read as supply positioning itself for sale. This metric has its own blind spot, though: internal transfers between an exchange's own wallets, or custodial reshuffling, can register as netflow even though no holder actually changed their intent. It's best used to confirm a direction MVRV and SOPR are already suggesting, not as a standalone signal.
A Worked Example
Suppose Bitcoin has fallen 60% over six months, and at a given point the data shows: an MVRV Z-Score of -0.3 (below zero, in the undervalued zone), a SOPR that has touched close to 1.0 three times over the past two weeks and bounced each time to 1.02–1.05, and a 30-day exchange netflow that has turned consistently negative. Read together, this suggests three things lining up across different time horizons: the market as a whole is sitting near a historically loss-heavy zone (MVRV), short-term loss-driven selling appears to be losing momentum (SOPR holding 1.0), and coins are actually leaving exchanges for longer-term storage (netflow). Analysts often describe this kind of setup as on-chain signals "aligning" near a bottom. That's still not a green light to enter on its own — it's a piece of supporting context to weigh alongside trend, macro conditions, and position sizing, not a trigger by itself.
Limits and Caveats
- Lag and reporting differences. On-chain data only finalizes once blocks confirm, and providers differ in methodology and update frequency, so real-time precision has limits.
- Mostly built for Bitcoin and Ethereum. These metrics require enough transaction history to track when coins last moved. That works well for Bitcoin and Ethereum but breaks down for newer altcoins with short on-chain histories.
- Wrapping, mixing, and exchange-internal moves distort the picture. Coins shuffled between an exchange's own wallets, wrapped (e.g., into wBTC), or run through a mixer can register as "movement" that has nothing to do with an actual holder's profit or intent.
- These are rules of thumb, not fixed laws. The Z-Score bands and the SOPR 1.0 line reflect patterns repeated across past cycles, not statistically proven constants. As market structure changes — more long-term holders, new ETF flows — the same numeric threshold can mean something different than it used to.
- Never a standalone signal. On-chain metrics show one axis: the market's aggregate profit and loss state. Trading purely off them, without weighing macro conditions, volume, or derivatives positioning (see Lesson 62 and Lesson 64), isn't something this course recommends.
FAQ
If the MVRV Z-Score crosses 7, should I sell immediately?
No. That threshold is a rule of thumb drawn from past cycles, not a fixed trigger — and as the market matures, the same degree of "overheated" has shown up at lower Z-Score readings than in earlier cycles. It's more useful as context ("we're in territory that's historically been extreme") than as a mechanical sell signal.
Can I just watch one of MVRV or SOPR instead of both?
You can, but you lose information. MVRV positions you within the slow-moving cycle; SOPR tracks the fast-moving daily shift in selling pressure. Watching both together lets you build a more specific picture, like "we're near a cyclical low, and today's selling pressure is also fading" — something neither metric alone tells you.
Do these metrics work for stock markets too?
Not directly. MVRV and SOPR rely on a blockchain permanently recording the price at which a coin last moved — stock ledgers don't expose anything comparable. The closest equivalents in equities are alternative-data approaches like insider cluster buying (Lesson 37) or dark pool prints (Lesson 25), which use disclosure and execution data rather than a public ledger.
Summary
- On-chain analysis uses the price at which coins last moved on a public blockchain to gauge holders' aggregate profit and loss — a completely different data axis from price or volume alone.
- The MVRV Z-Score measures unrealized profit/loss across every coin in existence on a slow, cycle-length time horizon; below 0 is commonly read as undervalued and above 7 as overheated, both as rules of thumb rather than fixed rules.
- SOPR measures realized profit/loss only on coins that moved on-chain today, and the 1.0 line tends to act like support in uptrends and resistance in downtrends.
- Exchange netflow adds a third confirming angle by tracking where coins are actually moving; when all three point the same way — a cyclical low, fading loss-selling, and coins leaving exchanges — analysts describe the signals as aligning.
- Given lag, distortion risk, and shifting thresholds as market structure evolves, on-chain metrics are best treated as supporting context rather than a standalone trading signal.