Trading Strategies · Lesson 25/57 · 9 min read
Dark Pool Prints: Reading Hidden Block Trades to Track Institutional Flow
In this article
- Why the Biggest Trades Are the Ones You Never See
- What a Dark Pool Print Actually Tells You
- Print Price vs. VWAP: Accumulation or Distribution?
- A Worked Example: Screening for Dark Pool Accumulation
- Dark Pool Prints vs. Options Sweeps: Same Goal, Different Market, Different Confidence
- Why This Signal Can Work: A Market Microstructure View
- Limitations and Pitfalls
- FAQ
- Summary
Why the Biggest Trades Are the Ones You Never See
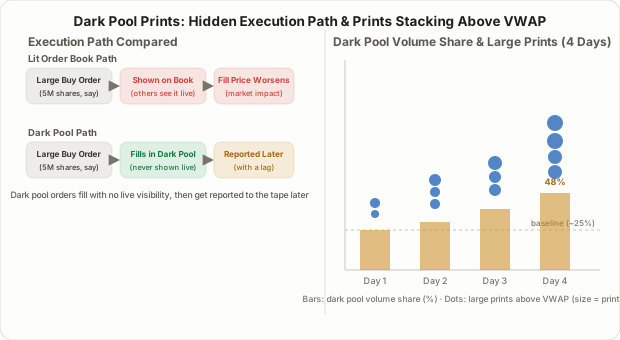
The public order book is supposed to be exactly that — public. Yet a large share of the trades that actually move the market never touch it at all. Say a pension fund needs to buy five million shares of a stock. Route that order straight into the lit exchange order book, and every other participant on the tape sees the size coming and starts bidding the price up ahead of it. The fund ends up chasing its own order — a textbook case of market impact working against the very trader who caused it.
To sidestep that problem, institutions route large orders through dark pools — private trading venues formally classified as Alternative Trading Systems (ATS). Orders sitting in a dark pool are never shown on a public order book before they execute. Only after a trade fills does it get reported to the tape, via FINRA's Trade Reporting Facility (TRF), and even then with a reporting lag. Lesson 22 covered options sweeps — a footprint left by aggressively taking the visible order book. Dark pool prints are the mirror image: a footprint left by orders that were never visible to begin with, reconstructed after the fact from post-trade reporting data.
💡 The share of volume dark pools handle shifts over time, but multiple market-structure reports have repeatedly put dark pools and other off-exchange venues at somewhere around 40% of total US equity volume in recent periods. The exact figure varies by data provider and methodology, so treat the number less as a fixed statistic and more as a directional reminder that this is not a fringe corner of the market.
What a Dark Pool Print Actually Tells You
A dark pool print is a single reported trade that executed inside a dark pool. Each print carries a price, a size, and a timestamp — but critically, it never identifies the buyer or seller. Anonymity is the entire reason dark pools exist in the first place.
So traders analyzing dark pool data aren't trying to figure out who traded. They're working with what's actually observable:
- How big is it? A print well above typical trade size (a common rule of thumb is 10,000+ shares, or roughly $200,000+ in notional value) is more likely institutional than retail.
- Where did it print relative to VWAP? Comparing the fill price to that day's volume-weighted average price hints at whether the buyer or seller was in more of a hurry.
- How persistent is it? A single large print on one day is noise. The same directional pattern repeating across multiple sessions is a different story.
Combine those three observations and you get circumstantial evidence about what kind of flow is accumulating — even though you'll never learn who is behind it.
Print Price vs. VWAP: Accumulation or Distribution?
The most widely used lens for reading a dark pool print is where it filled relative to that day's VWAP (volume-weighted average price). Because VWAP represents the average price paid across all volume that day, a print sitting meaningfully above or below it is a clue about how much urgency was behind the order.
| Fill location vs. VWAP | Common interpretation | Caveat |
|---|---|---|
| Notably above VWAP | Buyer paid up for size — often read as accumulation | Could also just reflect a seller dumping into weak demand; not conclusive alone |
| Near VWAP | Consistent with routine rebalancing, index fund flows | Weak directional signal |
| Notably below VWAP | Seller accepted a discount to move size — often read as distribution | Could reflect a large buyer picking up shares cheaply from a motivated seller |
This table reflects conventions traders commonly cite, not verified fact. A fundamental limitation applies here: dark pool reporting frequently doesn't disclose which side initiated the trade (buyer-initiated vs. seller-initiated), on top of never disclosing identity. Treat VWAP position as circumstantial evidence, not a confirmed trade direction.
Screening Criteria for Large Prints
Like options sweeps in Lesson 22, a single dark pool print rarely means much on its own. In practice, traders look for several conditions overlapping at once.
| Screening criterion | Common rule of thumb | What it suggests |
|---|---|---|
| Print size | 10x+ average trade size, or $200,000+ notional | Less likely to be coincidental overlap of small retail orders |
| Daily dark pool volume share | 40-50%+ of the stock's total daily volume | Noticeably more flow routed off-exchange than usual |
| Persistence | Large same-direction prints (VWAP-relative) repeating across 3+ sessions | Suggests sustained position building rather than a one-off trade |
| Technical location | Near support/resistance, or inside a range with no strong prevailing trend | Accumulation/distribution reads carry more weight than mid-trend |
These thresholds are conventions individual data vendors set, not regulatory standards. The "40-50% dark pool volume share" figure in particular varies enormously with a stock's market cap and normal liquidity, so it's more useful to measure the deviation from that stock's own baseline than to anchor on the absolute number.
A Worked Example: Screening for Dark Pool Accumulation
Consider a hypothetical Stock D that's spent the last two months chopping sideways in a tight range with no clear trend. Over the most recent four trading sessions, the following pattern shows up in the data:
- Daily dark pool volume share jumps from its usual ~25% baseline to 48%
- Dark pool prints fill an average of 0.4% above that day's VWAP, four sessions in a row
- Individual prints of 30,000+ shares appear two to three times per day
- No earnings, news, or other obvious catalyst during this window
That combination is a textbook shape for quiet accumulation without a catalyst — the volume-share spike, the persistence of above-VWAP fills, and the recurring large-print size all lining up together. It's not, on its own, proof of an imminent breakout. A more disciplined approach checks this against the resistance levels from a volume profile read (Lesson 12) and treats a technical confirmation — price actually clearing the range top on rising volume — as the trigger to act, rather than the dark pool data alone.
Dark Pool Prints vs. Options Sweeps: Same Goal, Different Market, Different Confidence
Dark pool prints and options sweeps (Lesson 22) both chase the same goal — tracking large-trader footprints — which is exactly why they're easy to conflate. But the market being observed and the character of the signal are quite different.
| Aspect | Dark Pool Prints | Options Sweeps |
|---|---|---|
| Market observed | Equities (private ATS venues) | Options (public exchanges) |
| Visibility at execution | Reported after the fact, never shown live | Visible on the public tape almost immediately |
| What the signal reveals | How much size moved, and at what relative price, quietly | How much urgency was behind a directional bet |
| Leverage | None — 1:1 shares | Yes — premium buys outsized notional exposure |
| Likelihood it's a hedge | Relatively lower — equity flow skews toward outright positioning | Relatively higher — could be one leg of a multi-leg structure |
If options sweeps reveal urgency — paying up to get filled right now — dark pool prints reveal the opposite instinct: the intent to move size quietly, without being noticed. It's a useful contrast: one technique tracks impatience, the other tracks discretion.
Why This Signal Can Work: A Market Microstructure View
The logic here traces back to why institutions choose dark pools in the first place. Routing an order to a private venue only makes sense if the trader specifically wants to avoid tipping the market off. A retail-sized order has little reason to go that route — dark pool access typically comes with minimum order-size requirements and routes through a broker-dealer, which is not the path a small individual trade would normally take.
So when a stock's dark pool volume share spikes noticeably above its own baseline, that's reasonable circumstantial evidence that a participant handling meaningful size is active in that name. That doesn't mean the price is guaranteed to move in the implied direction, though — what looks like accumulation could just as easily be a large seller working out of a position in pieces, or purely mechanical flow from an index fund's scheduled rebalance that has nothing to do with a directional view.
Limitations and Pitfalls
- Buyer and seller are never distinguishable. This is the fundamental limitation of dark pool data — you genuinely cannot know who initiated a print. VWAP position is an inference, not a confirmed trade direction.
- Reporting lag is real. Prints are reported after execution, not live, and the delay varies by data provider. Free data tends to be more delayed and more aggregated than paid feeds.
- Hard to distinguish from routine rebalancing. Index fund and ETF rebalances, or a pension fund's scheduled asset-allocation shift, can produce large dark pool prints with zero directional intent behind them.
- Volume-share figures vary by provider. Different data vendors classify different sets of venues as "dark pool" and aggregate differently, so the reported share for the same stock can differ meaningfully across services.
- Weak as a standalone signal. A dark pool print in isolation is thin evidence. It's most useful layered on top of existing technical analysis — support/resistance, volume profile, prevailing trend — rather than treated as a trigger by itself.
FAQ
Which is more reliable — dark pool prints or options sweeps?
Neither is categorically better. Options sweeps reveal direction (calls vs. puts) more explicitly but carry a relatively higher chance of being hedge-related. Dark pool prints only hint at direction circumstantially but tend to reflect equity-market real demand more directly, since equity flow skews less toward hedging than options flow does. Cross-referencing both is generally considered more prudent than leaning on either alone.
Can retail traders see dark pool data in real time?
Access has improved as several financial data services have started offering dark pool volume-share and large-print visualizations, some free and some paywalled. Fully real-time, unaggregated data is still mostly behind a paid subscription — free tiers are usually delayed or summarized.
Is heavy dark pool activity in a stock a red flag or something illegal?
No. Dark pools are a legal, SEC-regulated part of US market structure, and large institutions use them routinely to reduce market impact — this is normal infrastructure, not a warning sign by itself. That said, "the venue is legitimate" and "this specific print carries directional information" are two separate questions, and the screening process covered in this lesson is about answering the second one, not the first.
Summary
- Dark pools are private trading venues (ATS) that large institutions use to move size without moving the price against themselves; trades only reach the public tape after the fact, and with a reporting lag.
- Reading dark pool prints means inferring what kind of flow is building — not who's behind it — using print size, position relative to VWAP, and persistence across sessions.
- Large prints repeatedly filling above VWAP are commonly read as accumulation, and repeatedly filling below VWAP as distribution — but that's a widely cited convention, not a confirmed rule, since buyer/seller identity and initiation side are rarely disclosed.
- Options sweeps reveal urgency; dark pool prints reveal discretion — two techniques chasing the same "who's trading big" question through different markets and different psychology.
- Because buyer and seller can never be distinguished and reporting lags are real, dark pool signals work best as a supporting layer on top of existing technical analysis, not as a standalone entry trigger.