Trading Strategies · Lesson 28/57 · 9 min read
VIX Term Structure Trading: Reading Contango and Backwardation to Gauge the Volatility Regime
In this article
- The VIX Headline Number Isn't the Whole Story
- VIX the Index vs. VIX Futures
- Contango and Backwardation: Two Shapes the Curve Can Take
- Why the Curve Takes This Shape: Insurance Pricing and Panic Asymmetry
- Contango Strategy vs. Backwardation Strategy: Same Indicator, Opposite Playbooks
- Roll Yield in Numbers: A Worked Example
- Why Short Volatility Is Dangerous: The 2018 Lesson
- How Traders Use This in Practice
- Limitations and Caveats
- FAQ
- Summary
The VIX Headline Number Isn't the Whole Story
When a headline says "VIX crosses 20," most people just check whether that number sounds high or low. But the VIX isn't a single tradable number — it's a curve made up of VIX futures contracts expiring at different dates. Lesson 15 on gamma exposure covered the pressure options dealer hedging puts on price. This lesson goes one level more macro: what the shape of the VIX futures curve — its term structure — actually tells you. The same VIX level of 20 can mean two very different market regimes depending on what that curve looks like.
VIX the Index vs. VIX Futures
The VIX index itself is a calculated 30-day forward volatility estimate derived from S&P 500 options prices — it isn't something you can buy or sell directly. What traders actually trade is VIX futures, and multiple contracts with different expirations (one-month, two-month, three-month, and so on) trade simultaneously. VIX-linked ETNs and ETFs — the long- and short-volatility products retail traders actually access — are built by rolling positions in these futures contracts day after day.
The key idea: the price of a near-dated future and a far-dated future usually differ, and the pattern of that gap reflects the market's current psychological state.
Contango and Backwardation: Two Shapes the Curve Can Take
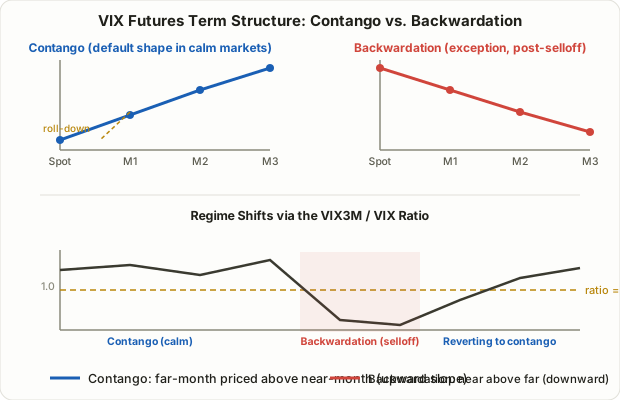
- Contango: Futures with later expirations are priced higher than nearer ones — the curve slopes upward. This is the market's "default" shape during calm periods, reflecting the basic idea that uncertainty further out in time deserves a bigger premium than uncertainty right now.
- Backwardation: The opposite — near-dated futures trade above far-dated ones, so the curve slopes downward. This means the market is pricing in more fear for right now than for three months out, and it typically shows up right after a sharp selloff or a shock event.
A quick shorthand for reading this is the VIX3M/VIX ratio. A ratio above 1 (the three-month contract priced above spot-like VIX) signals contango; below 1 signals backwardation. That threshold isn't a hard line, though — traders often treat the 0.95–1.05 band as an ambiguous transition zone rather than a clean switch.
Why the Curve Takes This Shape: Insurance Pricing and Panic Asymmetry
Contango being the market's "default" state makes intuitive sense once you think of VIX futures as a form of insurance. Nobody knows exactly what will happen months from now, so buyers of longer-dated volatility exposure are generally willing to pay a premium for that uncertainty. This shape holds during most of the calm stretches in markets, and VIX futures are commonly said to spend the large majority of trading days in contango, with backwardation clustering around crisis and selloff periods — though the exact split is a loosely cited approximation that varies by the period and methodology used, not a fixed statistical law.
Backwardation shows up for the opposite reason. Once a market is already selling off sharply, or a shock event has just hit (an earnings disaster, a geopolitical crisis, a credit event), the fear people feel about right now dwarfs whatever they feel about three months out. That psychology bids up near-month contracts hard enough to flip them above the far-month price. Backwardation episodes tend to be short-lived — once the panic subsides, the curve tends to snap back toward contango.
Contango Strategy vs. Backwardation Strategy: Same Indicator, Opposite Playbooks
Depending on which side of the curve the market sits on, traders reach for two fundamentally different approaches.
| Contango Playbook (Roll-Yield Harvesting) | Backwardation Playbook (Mean Reversion / Hedging) | |
|---|---|---|
| Core premise | Near-month futures are cheaper than far-month ones, so time creates downward "roll" pressure toward spot | Volatility spikes rarely persist, so an extreme VIX reading has some tendency to fade |
| Typical approach | Sell VIX futures, or use products/strategies structured to be short volatility | Position for the curve normalizing back into contango, or reassess portfolio hedges as panic subsides |
| What it targets | Repeatedly capturing the contango gap itself (roll yield) | The snapback once a panic-driven dislocation normalizes |
| Risk profile | A sudden volatility spike can produce fast, large, nonlinear losses | Timing the "calming down" point wrong means entering while volatility is still expanding |
| Market regime | Recurs repeatedly during calm-to-mildly-bullish, range-bound stretches | Only valid in the narrow window right after a selloff or crisis |
The contango playbook is about grinding out small, repeated gains in a quiet market. The backwardation playbook is about catching a short-window snapback once you judge the panic to be overdone. The reason these two shouldn't be approached the same way comes down to that risk asymmetry.
Roll Yield in Numbers: A Worked Example
In contango, the price gap between near- and far-dated contracts shows up as "roll yield" as futures prices converge toward spot with the passage of time. Here's a hypothetical to make the mechanics concrete.
- VIX spot: 15
- VIX 1-month future: 16
- VIX 3-month future: 18
Here the VIX3M/VIX ratio is 18 ÷ 15 = 1.2 — clear contango. The 2-point gap between the 1-month and 3-month contracts (roughly 12.5% relative to the 1-month price) reflects the fact that, as time passes, the 3-month contract becomes a progressively shorter-dated one and its price converges toward the 1-month level. A short-volatility position (or a product structured this way) is, in theory, positioned to capture that convergence gap repeatedly.
You shouldn't read that number as "12.5% monthly return," though. Real VIX-linked products rebalance daily, and compounding, expense ratios, and slippage all interact with that rebalancing — creating a meaningful gap between the theoretical contango spread and what an actual product delivers over time. Here's the mirror-image scenario:
- VIX spot: 35 (right after a sharp selloff)
- VIX 1-month future: 32
- VIX 3-month future: 27
The VIX3M/VIX ratio here is 27 ÷ 35 ≈ 0.77 — clear backwardation. This shape reflects the market's tentative read that "right now might be close to the peak of fear," but whether it actually was the peak can only be confirmed in hindsight — trading purely off this ratio to call a bottom is risky.
Why Short Volatility Is Dangerous: The 2018 Lesson
Strategies that repeatedly harvest roll yield in contango (short volatility) tend to look steady in normal times, but the payoff structure is fundamentally asymmetric. Small gains accumulate quietly most of the time, and then a sudden volatility spike can wipe out far more than what was accumulated, in a very short window. "Climbs the stairs, takes the elevator down" is a phrase frequently used to describe this payoff shape in short-vol strategies.
That risk played out concretely in February 2018: when a sharp one-day market selloff sent the VIX spiking, several exchange-traded notes structured to be short volatility lost most of their value in a single session and were subsequently redeemed or delisted — an episode widely referred to as "Volmageddon." It's a stark illustration of the "small steady gains, occasional catastrophic loss" nature of contango roll-yield strategies. Leveraged short-volatility products amplify this risk even further.
How Traders Use This in Practice
VIX term structure isn't a direct buy/sell signal for any individual stock, but it's widely used as context for the market's overall risk regime.
- Steep contango: A signal that the broader market is likely in a relatively stable state, which can be a more favorable backdrop for trend-following approaches like Lesson 2 momentum trading or Lesson 9 trend-pullback entries.
- Entering backwardation: A signal that the market has entered a stress regime. Many traders prioritize reducing risk and raising cash over opening new positions here — a moment where the discipline covered in Lesson 6 on risk-reward and money management matters more than usual.
- Reverting from backwardation back to contango: Often interpreted as panic subsiding, but timing that turn precisely is difficult, and a false snapback followed by renewed selling is common.
Limitations and Caveats
- The curve's shape doesn't tell you price direction. Term structure is about volatility expectations, not the direction of the underlying market. Contango doesn't guarantee stocks go up, and backwardation doesn't guarantee you're at a bottom.
- VIX-linked products are structurally unsuited to long-term holding. Because these products rebalance daily, persistent contango tends to erode capital gradually over extended holding periods — most are explicitly designed for short-term, tactical use rather than buy-and-hold.
- Leveraged products carry extreme tail risk. 2x or 3x leveraged volatility products can lose a large share of their value in a single session during a volatility spike.
- The ratio threshold is a rule of thumb, not a trigger. Rather than treating VIX3M/VIX crossing 1.0 as a binary signal, it's more useful to watch the size of the gap and how quickly it's changing.
FAQ
Can retail traders trade VIX futures directly?
Yes, but it requires a futures account and margin, and most retail traders instead get exposure indirectly through VIX-linked ETNs and ETFs. Those products carry their own futures-rolling costs and structural decay, so it's worth reading the fund's stated methodology before using one.
If I'm short volatility during contango, am I guaranteed to profit?
No. Small gains tend to accumulate over most periods, but an unexpected volatility spike can produce a loss that dwarfs everything accumulated up to that point, in a very short window. This structure inherently carries tail risk, and that should always be assumed going in — not treated as a remote edge case.
Where can I check the VIX3M/VIX ratio?
The CBOE and most financial data platforms publish VIX index and VIX futures prices you can use to compute the ratio yourself, and several data services also provide it pre-calculated.
Summary
- The VIX isn't one number — it's a curve made up of futures contracts across different expirations, and the shape of that curve (its term structure) tells you whether the market is calm or under stress right now.
- Contango, where far-dated futures trade above near-dated ones, is closer to the market's default state; backwardation, where near-dated futures trade above far-dated ones, is the exception that typically shows up around selloffs and crises.
- In contango, traders often talk about harvesting roll yield from short-volatility positioning as futures roll down toward spot; in backwardation, traders often watch for a snapback once panic looks overdone — and the two carry very different risk profiles.
- Contango roll-yield strategies have an asymmetric payoff — small, steady gains most of the time, with the possibility of a sharp, outsized loss during a volatility spike — and the 2018 Volmageddon episode is a stark real-world illustration of that risk.
- VIX term structure works best as context for gauging the market's risk regime, not as a standalone directional signal, and should be used alongside other strategies and risk-management discipline.