Trading Strategies · Lesson 57/57 · 8 min read
Max Pain Theory: Calculating Where Options Expiration Pins the Stock Price
In this article
- Why People Claim Price Gravitates to One Strike at Expiration
- How Max Pain Is Actually Calculated
- A Worked Example
- Why This Happens: Two Competing Explanations
- Max Pain vs. Gamma Exposure (GEX): What's Actually Different
- How Traders Actually Use It
- Limitations and Caveats
- Frequently Asked Questions
- Summary
Why People Claim Price Gravitates to One Strike at Expiration
During options expiration week, you'll often see traders quote a single number as "today's max pain." Max Pain is the closing price at which the combined payout to every call and put buyer across a given expiration is smallest — equivalently, the price at which option sellers as a group lose the least. It's called "max pain" because that's the price that would hurt option buyers the most.
It's easy to confuse this with the pin risk covered in Lesson 15 on Gamma Exposure (GEX), but the two are calculated completely differently and rest on different logic. This lesson walks through exactly how max pain is computed, a worked numeric example, why the theory is debated, and where its evidence actually holds up.
How Max Pain Is Actually Calculated
The core idea is mechanical, not statistical. For a given expiration, you take every strike's open interest in calls and puts, and for every possible hypothetical closing price, you calculate the total dollar payout option buyers would collect if the stock closed there.
- A call only pays out if the close is above its strike: payout = (close − strike) × contract multiplier (usually 100) × call open interest.
- A put only pays out if the close is below its strike: payout = (strike − close) × multiplier × put open interest.
- Sum both across every strike for a given hypothetical close, and you get "total buyer payout" for that scenario. The closing price that minimizes this sum, across every strike in the chain, is the max pain price.
Notice what's absent here: no delta, no gamma, no implied volatility. Max pain is purely an accounting exercise over settlement value — arguably the simplest calculation of any options-derived metric on this site.
A Worked Example
Take a hypothetical name with open interest concentrated at four strikes for a given expiration: 100, 105, 110, and 115.
| Strike | Call open interest | Put open interest |
|---|---|---|
| 100 | 1,000 | 500 |
| 105 | 1,500 | 800 |
| 110 | 2,000 | 1,500 |
| 115 | 500 | 1,200 |
Now calculate total buyer payout (using a 100x multiplier) if the stock closes exactly at each of those four strikes:
| Closing scenario | Call buyer payout | Put buyer payout | Total buyer payout |
|---|---|---|---|
| 100 | $0 | $3,700,000 | $3,700,000 |
| 105 | $500,000 | $1,950,000 | $2,450,000 |
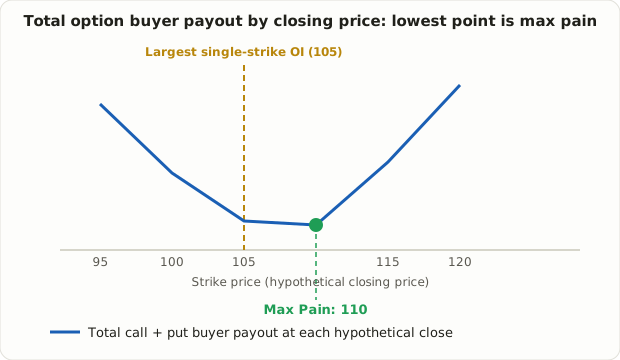
| 110 | $1,750,000 | $600,000 | $2,350,000 |
| 115 | $4,000,000 | $0 | $4,000,000 |
The minimum total payout falls at a close of 110, so 110 is the max pain price for this expiration. Notice that 105 — not 110 — is technically the strike with the smallest combined open interest of the four, yet 110 still produces the lower total payout once you actually sum the dollar amounts. That's the point worth internalizing: max pain isn't simply "the strike with the most open interest," it's whichever strike minimizes the aggregate payout once every strike in the chain is run through the calculation. Commercial data providers do exactly this arithmetic across every strike in a chain, automatically, to publish the number you see on a max pain chart.
Why This Happens: Two Competing Explanations
When traders invoke max pain in practice, they usually mean one of two different claims, often without distinguishing them.
- Deliberate steering. The claim that option sellers — typically market makers or large institutions — actively push price toward the max pain strike to minimize their own payout obligation. This version is the more controversial one. Sellers have usually already collected the premium and hedged the position, so the settlement payout at expiration often isn't the thing driving their P&L in the first place. The idea that sellers both have the market power and the incentive to steer price is a claim that hasn't been convincingly demonstrated.
- Coincidental overlap. The alternative explanation is that strikes with heavy open interest tend to be the same strikes with large gamma exposure, so the delta-hedging flow described in the GEX lesson creates genuine pin risk near those strikes as expiration approaches — independent of anyone "targeting" max pain. Under this view, max pain and the gamma pin level converge because they share a common cause (concentrated open interest), not because one causes the other.
The second explanation is generally taken more seriously by practitioners today. Either way, treat "price converges to max pain" as a pattern that sometimes shows up, not a rule that must hold.
Max Pain vs. Gamma Exposure (GEX): What's Actually Different
Both metrics start from the same raw data — options open interest — but they measure fundamentally different things.
| Max Pain | Gamma Exposure (GEX) | |
|---|---|---|
| What it calculates | Total settlement payout to option buyers at expiration | The hedge flow dealers need to trade to stay delta-neutral |
| Greeks involved | None — pure settlement arithmetic | Gamma (the rate of change of delta) |
| Basis for the claim | "Sellers steer price to minimize their payout" — weakly supported | Delta hedging is an observable, mechanical practice dealers actually perform — the underlying mechanism is comparatively well established |
| Time behavior | Usually computed once, statically, per expiration | Changes continuously in real time, and grows sharply as expiration nears |
| Practical use | A rough reference level to watch into expiration, not a standalone signal | Context for whether the current volatility regime favors dampening or amplification |
In short, max pain is a static "settlement accounting" number, while GEX is a dynamic "hedge flow" number. They sometimes point to the same strike, but that's because both start from the same open interest data — not because they describe the same mechanism.
How Traders Actually Use It
- Never as a standalone entry or exit signal. Treat max pain as one probabilistic reference level among several, to be weighed alongside trend, volume, and support/resistance — not traded in isolation.
- It's cited more often for lower-liquidity, single-stock names than for major indices. A widely referenced study examining 25 years of US stock and options data found the max pain convergence pattern showed up more consistently in smaller, less liquid names than in large-cap or index options. That's one study's finding, not a universal law, so weight it accordingly.
- Weekly expirations have diluted the effect. Open interest used to concentrate heavily in a single monthly expiration; now that expirations roll over weekly (and even daily on major indices), open interest is spread thinner across more expirations, and most practitioners consider the pull toward any single expiration's max pain weaker than it used to be.
- Earnings and macro catalysts override it easily. A strong news event blows straight through whatever pressure options positioning was creating. Max pain is best treated as a reference for an otherwise quiet, catalyst-free expiration week — not something to lean on around earnings or major data releases.
Limitations and Caveats
- The causal mechanism is unproven. No one has convincingly demonstrated why price should actually converge on the max pain strike beyond the coincidental-overlap explanation above. Don't mistake correlation for causation here.
- Calculations vary between data providers. Which strikes get included, how American- vs. European-style exercise is handled, and other implementation details differ, so the same underlying can show a different max pain price on different platforms.
- It can't distinguish hedged positions from naked ones. The calculation just sums raw open interest on each side, so spread and hedged positions get counted the same as naked directional bets even though their actual "pain" at expiration is very different.
- Easy to confuse with ordinary expiration-week volatility compression. Volatility often drops mechanically into expiration for unrelated reasons (theta decay, lighter volume), and it's tempting to misread that quieting as evidence of "pinning to max pain" when other factors are doing the work.
Frequently Asked Questions
Does max pain theory actually work?
It's mixed. Research suggests the convergence pattern shows up more often in lower-liquidity, single-stock names with concentrated open interest than in major indices, where macro news and institutional flow tend to dominate. Treat it as a probabilistic tendency, not a reliable rule.
Is max pain the same thing as a gamma wall?
No. A gamma wall, from the GEX lesson, is a strike where dealer delta-hedging flow creates real pin risk. Max pain is calculated purely from settlement payouts with no hedging mechanics involved. The two sometimes point at the same strike, but they're computed from different logic.
Where can I check the max pain price for a stock?
Several options data platforms and broker options-chain tools calculate it automatically from open interest. Because the underlying assumptions differ slightly by provider, treat the number as an approximate zone rather than an exact price.
Summary
- Max pain is the closing price, across every possible scenario, that minimizes the total settlement payout to call and put buyers on a given expiration.
- The calculation itself is simple: no Greeks involved, just summing intrinsic-value payouts per strike per scenario and finding the minimum.
- The "sellers deliberately steer price" explanation is weakly supported; the more credible explanation is that concentrated open interest happens to overlap with gamma pin zones, making the two look connected without one causing the other.
- Max pain and GEX both start from options open interest, but one is a static settlement calculation and the other is a dynamic hedge-flow measure — fundamentally different metrics that sometimes agree by coincidence.
- The pattern shows up more consistently in lower-liquidity names than in major indices, and strong news or macro catalysts override it easily, so use it as a secondary reference level rather than a standalone signal.