Trading Strategies · Lesson 56/57 · 8 min read
Heikin-Ashi Candles: How They Differ From Regular Candlesticks and How to Trade With Them
In this article
- What Heikin-Ashi Actually Is: Candles Built From Averages
- The Formula: Why It Comes Out So Smooth
- Reading Trend Strength From Candle Shape
- The Standard Combo: Higher-Timeframe Heikin-Ashi, Lower-Timeframe Regular Candles
- Heikin-Ashi vs. Regular Candlesticks: A Direct Comparison
- A Worked Numeric Example
- Limitations to Keep in Mind
- FAQ
- Summary
What Heikin-Ashi Actually Is: Candles Built From Averages
The candlestick basics lesson and Lesson 52's candlestick pattern trading both deal with regular "Japanese candlesticks," which plot the actual open, high, low, and close of each period. Heikin-Ashi (平均足, literally "average bar") is a different way of drawing a candle: instead of the real OHLC values, each candle is recalculated by blending today's price data with the previous candle's values. The technique traces back to Japanese trading circles and has seen a resurgence in recent years across YouTube trading-education channels and the TradingView community, usually pitched as "a chart that shows the trend without the noise."
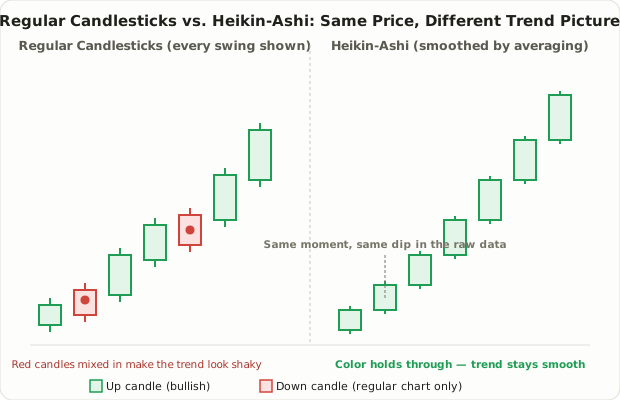
The core idea is simple. A regular candlestick chart shows every up-and-down tick honestly, which means even a healthy uptrend will show plenty of red (down) candles mixed in — creating a visual illusion that the trend is constantly wavering. Heikin-Ashi smooths that noise out by averaging, so that as long as the underlying trend holds, the candles keep the same color in a long, clean run.
The Formula: Why It Comes Out So Smooth
Each Heikin-Ashi (HA) candle's four values are derived from the regular candle's open (O), high (H), low (L), and close (C):
- HA Close = (today's O + H + L + C) ÷ 4
- HA Open = (previous HA Open + previous HA Close) ÷ 2
- HA High = MAX(today's H, HA Open, HA Close)
- HA Low = MIN(today's L, HA Open, HA Close)
The second line is the important one. Because today's HA Open is a 50/50 blend of yesterday's HA Open and HA Close, every Heikin-Ashi candle carries forward a piece of the previous one — structurally similar to how a moving average carries forward past prices. That's exactly why the candles flow into each other smoothly instead of jumping abruptly, and why a brief pullback often gets absorbed into the average without even flipping the candle's color.
Reading Trend Strength From Candle Shape
The main practical use of Heikin-Ashi is treating each candle's shape as a read on trend strength. These interpretations are widely taught conventions, not rigid rules:
| Candle Shape | Commonly Cited Interpretation |
|---|---|
| Long green body, little to no wicks | Very strong uptrend — almost no selling pressure |
| Green body with a lower wick | Uptrend intact, but pullback pressure is building |
| Short body with wicks on both sides | Buyers and sellers roughly balanced — a caution flag for trend exhaustion or a possible reversal |
| Red body with an upper wick | Early signs of a downside shift, though upside attempts remain |
| Long red body, little to no wicks | Very strong downtrend — almost no buying pressure |
The most commonly cited rule of thumb is: once bodies start shrinking and wicks appear on both ends, treat it as an early warning that the trend is losing steam and prepare your risk management accordingly, rather than waiting for the candle color to actually flip. This is a widely used heuristic among traders, not a guaranteed signal.
The Standard Combo: Higher-Timeframe Heikin-Ashi, Lower-Timeframe Regular Candles
Across trading-education content that covers Heikin-Ashi, one combination comes up again and again — splitting the analysis across two timeframes.
- Use Heikin-Ashi on a higher timeframe (daily or 4-hour) to confirm the broader direction. An unbroken run of green candles with minimal wicks reads as a healthy higher-timeframe uptrend.
- Switch to regular candlesticks on a lower timeframe (1-hour or 15-minute) to time actual entries and exits. Since the Heikin-Ashi close isn't a real traded price, entries and stop-losses should always be set against real candlestick prices.
This mirrors the exact same structure used in Lesson 9's pullback re-entry strategy — confirm the bigger trend first, then time the entry off a separate, faster signal. The only difference is that the tool used to confirm the bigger trend here is Heikin-Ashi's candle color and shape rather than a moving average.
Heikin-Ashi vs. Regular Candlesticks: A Direct Comparison
Neither chart replaces the other — they process the same price data for different purposes, which is why the comparison matters more than picking a "winner."
| Heikin-Ashi | Regular Candlestick | |
|---|---|---|
| What it displays | Blended average of current and prior candle | Actual open/high/low/close |
| Noise level | Low — easier to read trend | High — every fluctuation shown |
| Signal speed | Slow (lagging) | Fast |
| Shows real closing price | No | Yes |
| Suitable for setting stops/targets | No — the values are averaged, not real prices | Yes |
| Traditional patterns (doji, hammer, etc.) | Distorted, hard to apply as-is | Apply as originally designed |
| Best-suited market condition | Clear, sustained trends | Range-bound markets, short-term timing |
The most operationally important row here is "suitable for setting stops/targets." Because the Heikin-Ashi close is a mathematical average rather than a price anyone actually traded at, using it directly as an order price or stop-loss level can create a real gap between your intended price and the market's actual price. That's why, even when Heikin-Ashi is displayed on the chart, the widely recommended practice is to place actual orders against real candlestick or live quote prices.
A Worked Numeric Example
To make the math concrete: suppose yesterday's HA Open was $48.00 and yesterday's HA Close was $50.00. Today's real prices come in at O=$51.00, H=$53.00, L=$50.50, C=$52.50.
- Today's HA Close = (51.00 + 53.00 + 50.50 + 52.50) ÷ 4 = $51.75
- Today's HA Open = (yesterday's HA Open $48.00 + yesterday's HA Close $50.00) ÷ 2 = $49.00
- Today's HA High = MAX(53.00, 49.00, 51.75) = $53.00
- Today's HA Low = MIN(50.50, 49.00, 51.75) = $49.00
The resulting candle opens at $49.00 and closes at $51.75 — a green candle with no lower wick (its low equals its open) and only a small upper wick. Notice that the HA candle appears to open at $49.00, well below the real opening price of $51.00. That gap exists purely because the HA Open is blended with yesterday's values — a useful reminder of exactly why Heikin-Ashi candles never quite match the real traded prices on the chart.
Limitations to Keep in Mind
- It's inherently lagging. Because each value blends today's data with yesterday's, Heikin-Ashi carries a structural lag similar to a moving average — signals tend to arrive after the real trend shift has already begun.
- You can't see the real closing price. As the example above shows, HA open/close values diverge from actual traded prices. Any decision that needs exact price information — reading the order book, setting a precise stop — requires checking a real candlestick chart or live price alongside it.
- It can underperform in range-bound markets. Heikin-Ashi's strength is smoothing a clear trend into an easy-to-read run of candles; in a choppy, directionless range, that same smoothing can blur or delay the signal, causing traders to enter late or miss reversals entirely.
- Traditional candlestick patterns don't translate cleanly. Patterns like doji and hammer, covered in Lesson 52, are defined around the relationship between real open and close prices. Applying those same pattern definitions to Heikin-Ashi's averaged values is a common source of misreads.
- Many traders consider it unsuitable for short-term scalping. The same noise-removal that makes Heikin-Ashi useful for trend-following becomes a liability when a strategy needs to react within minutes — the lag works directly against fast execution.
FAQ
Is Heikin-Ashi the same as "Heiken Ashi"?
Yes. Both are transliterations of the Japanese term 平均足 into English, and they refer to the exact same technique. You'll see both spellings used interchangeably across trading platforms and educational content.
Can I trade using only Heikin-Ashi candles?
It's not generally recommended. Heikin-Ashi is strong at showing trend direction and strength intuitively, but it doesn't show real traded prices and its signals lag. The safer, more widely practiced approach is to set actual entries and stops against real candlestick or live quote prices, and use Heikin-Ashi as a supporting tool for reading the broader trend.
What timeframe works best with Heikin-Ashi?
There's no fixed rule, but a common approach is to use it on relatively longer timeframes — daily or 4-hour charts common in swing trading — for trend confirmation, then switch to a shorter timeframe with regular candles for actual entry timing. Many traders find that on very short timeframes like 1-minute or 5-minute charts, Heikin-Ashi's inherent lag works against them more than it helps.
Summary
- Heikin-Ashi doesn't plot real prices — each candle blends today's OHLC with the previous candle's values, smoothing out noise to make the trend easier to read at a glance.
- Because HA Open is an average of the prior candle's open and close, candle colors tend to run in long, consistent streaks, and brief pullbacks are often absorbed without a color change.
- The standard practical combo is: Heikin-Ashi on a higher timeframe for trend confirmation, regular candlesticks on a lower timeframe for actual entry and stop-loss prices.
- The single most important limitation is that the Heikin-Ashi close isn't a real traded price — orders and stops should always be set against real candlestick or live prices, never the HA value directly.
- Given its lag, weaker performance in range-bound conditions, and incompatibility with traditional candlestick patterns, Heikin-Ashi is best used as a trend-reading aid rather than a standalone trading signal.