Trading Strategies · Lesson 15/57 · 5 min read
Gamma Exposure (GEX) Explained: How Options Dealer Hedging Pins and Whips Stock Prices
In this article
Why Prices Sometimes Freeze Near a Level Into Expiration
You've probably noticed a stock or index grinding in an unusually tight range near a specific price right before an options expiration — especially the weekly zero-days-to-expiration (0DTE) cycle that's become common on major indices. Other times, with no real news at all, a market suddenly whips much harder than usual. Both patterns are, to a meaningful degree, explained by hedging flows from options market participants — specifically gamma exposure (GEX). This lesson steps into a different layer entirely from the price- and volume-based techniques covered so far: the structural pressure options positioning exerts on the underlying's price.
It Starts With Delta Hedging
Options market makers (dealers) sit on the other side of the calls and puts that traders buy and sell. They aren't trying to profit from directional bets — their edge comes from the bid-ask spread — so once they've sold an option, they continuously offset the directional risk (delta) that position creates by buying or selling the underlying stock or futures. This is delta hedging.
The catch is that an option's delta isn't fixed — it constantly changes as the underlying's price moves. That rate of change — how fast delta shifts as price moves — is gamma. High gamma means a dealer has to rebalance their hedge aggressively even for a small price move.
Gamma Exposure (GEX): The Hedging Flow Dealers Owe the Market
A single option's gamma is negligible, but summing it across all the open interest at a given expiration and strike gives you an estimate of how much stock dealers would need to buy or sell to stay delta-neutral for every 1% move in the underlying. That aggregate is GEX. It's typically computed assuming dealers are net sellers of options (the standard convention), and the sign is read as follows.
- Positive GEX: under this convention, dealers are net long gamma, which means they need to sell as price rises and buy as price falls to stay hedged. That flow works against the move — it dampens volatility and pulls price back toward equilibrium.
- Negative GEX: dealers need to buy as price rises and sell as price falls to stay hedged. That flow pushes with the move instead of against it — it amplifies volatility rather than dampening it.
Pin Risk: Why Price Can "Stick" to a Strike Near Expiration
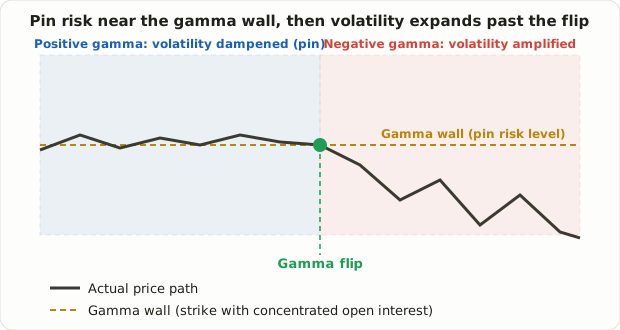
When open interest is heavily concentrated at one strike and that zone sits in positive gamma, price approaching that strike tends to trigger dealer hedging flow that pulls it back toward that level. Traders commonly call such a strike a "gamma wall." The closer expiration gets — and gamma grows sharply as expiration nears, especially for same-day 0DTE contracts — the stronger this pull tends to become. That's the mechanism behind what's often called "pin risk": an index or stock grinding tightly around a specific level into expiration with no obvious news driving it.
Conversely, if a strong macro event or earnings surprise pushes price through the gamma wall and into negative-gamma territory, the dampening force disappears and dealer hedging flips to reinforcing the move instead — which is one reason moves that break through a gamma wall can accelerate faster and further than usual.
⚠️ This relationship is a widely observed empirical pattern in markets, not a fixed law of physics. Exchanges don't publish dealers' actual aggregate positioning, so GEX estimates you see from data providers are approximations built on assumptions — most commonly, that dealers are net short options. Real positioning can diverge from that assumption, sometimes significantly.
How Traders Use It in Practice
GEX isn't a direct buy/sell signal so much as context for which volatility regime the market is currently closer to.
| Situation | Common interpretation |
|---|---|
| Positive gamma, open interest concentrated at one strike | Range-bound, mean-reverting behavior near that level is more likely — a fit with Lesson 3-style mean-reversion setups |
| Crossing into negative gamma (below the "gamma flip" level) | Trends that do emerge are more likely to accelerate — a fit with Lesson 2-style momentum following |
| Approaching a large monthly/quarterly expiration | Open interest unwinding and rolling can shift the gamma structure abruptly, making the usual pattern less reliable |
Some traders track the "gamma flip" point — where aggregate GEX crosses from positive to negative — as a rough boundary between regimes. This is a widely used rule of thumb, not a precise trigger, and it's generally treated as one input for calibrating confidence in a directional read rather than a standalone mechanical signal, best combined with trend, volume, and support/resistance context.
Limitations and Caveats
- Dealer positioning is an estimate, not a fact. Actual net dealer positioning is never publicly disclosed. Commercial GEX indicators back into it from open interest plus assumptions, and different data providers can show meaningfully different numbers for the same underlying because their assumptions differ.
- Retail access to raw options data is limited. Getting real-time open interest and implied volatility across strikes and expirations for a given underlying often requires a paid data subscription.
- 0DTE has sped everything up. Because gamma grows sharply as expiration approaches, the rise of same-day expiring contracts means the gamma structure on major indices can shift materially within a single trading day.
- Fundamentals can overwhelm it. Earnings, macro releases, or strong news can blow through whatever pressure the gamma structure was creating without much resistance. GEX is best treated as a secondary input on "which way price tends to drift absent other catalysts," not a standalone edge.
Summary
- Options dealers hedge the directional risk of the options they've sold by trading the underlying; gamma measures how fast that hedging flow needs to change as price moves.
- In positive-gamma zones, dealer hedging tends to pull price back toward a level (dampening volatility); in negative-gamma zones, the same mechanism tends to amplify moves instead.
- Strikes with heavy open interest in positive gamma are called "gamma walls," and pin risk around them tends to intensify as expiration approaches — especially with 0DTE contracts.
- GEX works best as context for whether the current regime favors mean reversion or accelerating trends, not as a standalone directional signal.
- Dealer positioning is an estimate rather than published fact, and strong fundamental catalysts can easily overwhelm whatever structural pull the gamma profile implies.