Trading Strategies · Lesson 86/87 · 9 min read
Multi-Timeframe Analysis (MTFA): Combining Higher-Timeframe Trend with Lower-Timeframe Entries
In this article
Why a Single Chart Keeps Fooling You
Almost every trader has had this happen: the 5-minute chart prints a textbook bearish reversal candle, you short it, and it turns out to be nothing more than a one-day dip inside a strong daily uptrend. Or the mirror case — a clean breakout fires on the 1-hour chart, you buy it, and price slams straight into a weekly resistance level and gives the whole move back. Both mistakes share the same root cause: looking at one timeframe in isolation and treating whatever happens inside it as a complete, self-contained signal.
Multi-Timeframe Analysis (MTFA), the subject of this lesson, is a structural fix for that problem. It isn't an indicator or a chart pattern — it's a decision framework for dividing labor across timeframes: which timeframe decides direction, and which one decides exact timing. This site's own strategy code already leans on this idea under the name "HTF filter" (see the MA pullback lesson); this lesson unpacks the logic sitting behind that filter.
The Three-Layer Time Structure, Borrowed From Dow Theory
MTFA's theoretical roots go back further than you'd expect. A century ago, Dow Theory already split market movement into three nested layers.
| Dow Theory's Layer | Conceptual Duration | Role in MTFA |
|---|---|---|
| Primary Trend | Months to years | The higher timeframe (HTF) — sets the overall direction, picks a side |
| Secondary Reaction | Weeks to months | The intermediate timeframe — confirms pullback zones and structure |
| Minor Trend | Days to weeks | The lower timeframe (LTF) — pins down the exact entry and exit |
The key insight: the movement on a smaller timeframe is largely noise and raw material contained inside the larger trend, not an independent event. Every wiggle on a 5-minute chart is just one of the ingredients that makes up a single daily candle, and the daily trend itself is just an ingredient of the weekly trend. Ignore that nested structure and look only at the smallest timeframe, and you'll routinely mistake what is, in the bigger picture, mere noise for an independent trading signal.
Why the HTF + LTF Combination Actually Works
MTFA isn't just the habit of keeping several charts open — it changes win rate and risk/reward through two concrete market mechanics.
First, the higher timeframe is where real capital actually moves. Institutional and fund positions don't get built in a single session. Large buy or sell programs get worked over days or weeks, and that accumulated flow is exactly what shows up as a daily or weekly trend. By contrast, a large share of what you see on a 5- or 15-minute chart is algorithmic short-term execution, scalper flow, and overreaction noise to headlines. Checking the higher-timeframe trend first is, in effect, checking which direction real size is actually accumulating in before you risk anything.
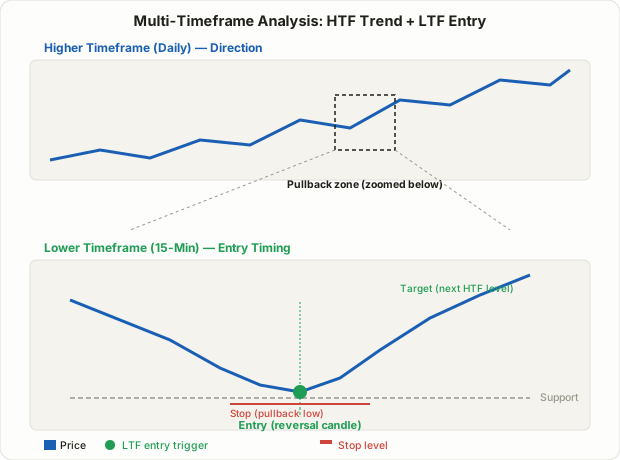
Second, the risk/reward structure itself improves. Restricting entries to the higher-timeframe direction means the lower-timeframe entry you take is, by definition, a pullback within that trend. The stop can sit at the pullback's local low or high (tight), while the target can reach for the next structural level the higher timeframe points toward (wide). MTFA doesn't directly guarantee a higher win rate — it structurally widens the R-multiple for the same win rate. A counter-trend entry, by contrast, tends to have a similarly tight stop but a target that runs straight into higher-timeframe resistance, which caps the reward and skews expectancy against you from the start.
The Timeframe Ratio Convention: Roughly 4x to 6x
So how many multiples apart should the higher and lower timeframe be? There's no hard rule, but a convention has settled in among practitioners — set the higher timeframe at roughly 4 to 6 times the interval of the lower timeframe. Too close together (say, 15-minute vs. 5-minute) and the two charts mostly repeat the same information. Too far apart (say, weekly vs. 1-minute) and the connective tissue between them gets so loose that it becomes hard to tell where exactly the lower timeframe sits within the bigger trend.
| Trading Style | Higher Timeframe (direction) | Intermediate (structure) | Lower Timeframe (entry trigger) |
|---|---|---|---|
| Position / long-term investing | Monthly | Weekly | Daily |
| Swing trading | Weekly | Daily | 4-hour |
| Day trading | Daily | 1-hour | 15-minute |
| Scalping | 4-hour | 1-hour | 1- to 5-minute |
These numbers aren't a rule so much as the most commonly cited convention. What matters more than the exact ratio is giving each layer a distinct job: the higher timeframe answers "should I trade this at all," and the lower timeframe answers only "exactly when do I pull the trigger." Try to answer both questions on the same single chart and the signals blur together.
The Top-Down Checklist
- Pick a side on the higher timeframe. Use moving-average alignment (e.g., the 20-day above the 60-day), swing structure (higher highs/higher lows vs. lower highs/lower lows), or a trend-strength tool like ADX to classify the symbol as uptrend, downtrend, or no clear direction. If direction is unclear, the rule is simple: that symbol is off the table for directional trades entirely.
- Mark the key levels on the intermediate timeframe. Flag the most recent swing high and low, major support/resistance, and any unfilled gaps. These levels act as a map telling you roughly where on the lower timeframe to even start looking for an entry.
- Wait for the trigger on the lower timeframe. Only look for an entry signal near the levels marked in step 2, in the direction set in step 1. If the lower timeframe prints a signal against that direction, treat it as a likely pullback — not an invitation to trade the other way.
💡 Worth repeating: the order of these steps matters. If you look at the lower-timeframe chart first, convince yourself "there's a signal here," and then go hunting on the higher timeframe for justification, confirmation bias will make almost any random signal look valid in hindsight. The analysis has to flow top-down — higher timeframe first, lower timeframe second — never the other way around.
A Numeric Illustration of the Risk/Reward Gap
Here's a hypothetical comparison showing how the risk/reward structure can shift for the same lower-timeframe entry pattern on the same symbol, with and without an HTF direction filter.
| No HTF Filter (trade either direction) | HTF Filter On (trend direction only) | |
|---|---|---|
| Average stop distance | 1.0R (same lower-timeframe pullback low/high) | 1.0R (identical) |
| Average target distance | 1.3R (counter-trend trade runs into higher-timeframe resistance quickly) | 2.2R (trend-direction trade has room to run to the next structural level) |
| Assumed win rate | 45% | 42% |
| Expectancy | (0.45 × 1.3R) + (0.55 × −1.0R) = 0.585 − 0.55 = +0.035R | (0.42 × 2.2R) + (0.58 × −1.0R) = 0.924 − 0.58 = +0.344R |
The win rate and R figures here are illustrative, not a real backtest result for any specific symbol — they're meant to show a general tendency: counter-trend entries tend to have their targets capped by higher-timeframe resistance (narrowing the R-multiple), while trend-direction entries tend to have room to run toward the next structural level (widening it). Even with a slightly lower win rate (45% → 42%), the R-multiple improvement is large enough that expectancy moves sharply in favor of the HTF-filtered approach — though real results will vary by symbol, market regime, and the specific rules used.
Common Mistakes
- Stacking too many timeframes. Running 4-5 charts at once and waiting for all of them to "agree" makes the conditions so strict that trade opportunities nearly vanish. Direction (higher) + levels (intermediate) + trigger (lower) is usually enough.
- Re-deciding the higher-timeframe bias too often. The higher timeframe is supposed to change slowly. If you find yourself re-evaluating the daily trend every 15 minutes, you're no longer actually using it as a higher timeframe.
- Forcing a lower-timeframe signal that isn't there. If the higher-timeframe direction is clear but the lower timeframe isn't giving a clean trigger, the correct answer is to do nothing. The expectation that a setup must appear every single day directly conflicts with how MTFA is supposed to work.
- Trading the lower timeframe alone when the higher timeframe is unclear. If the higher timeframe is ranging with no clear direction, even a textbook lower-timeframe pattern carries less reliability. In that case, switching to a range-specific approach like mean reversion is usually the more sensible move than forcing a trend trade.
FAQ
How many timeframes should I actually watch at once?
Three is usually enough: higher (direction), intermediate (levels), lower (trigger). Adding more timeframes can feel like it makes the analysis more rigorous, but in practice it usually just shrinks your trade frequency too far or creates confusion over which conflicting signal to trust.
What if the higher timeframe and lower timeframe disagree?
The higher timeframe wins by default. A lower-timeframe signal against the higher-timeframe direction should first be read as a pullback within that trend, not as a trade signal in its own right — not trading the opposite direction is the core discipline MTFA is built around.
Is MTFA specific to one strategy, or does it apply broadly?
It's indicator- and pattern-agnostic. You can layer "filter by higher-timeframe direction" on top of almost any strategy covered on this site — moving-average crossovers, breakouts, ICT order blocks, mean reversion, and more. The HTF filter used in the MA pullback strategy lesson is a direct, coded example of this exact principle in action.
Summary
- MTFA isn't an indicator — it's a decision framework that sets direction on a higher timeframe and times entries on a lower timeframe, rooted in Dow Theory's division between primary trend, secondary reaction, and minor trend.
- It works through two mechanics: the higher timeframe reflects real accumulated order flow, and lower-timeframe pullback entries let you keep stops tight while targets reach for higher-timeframe structure, structurally improving the risk/reward ratio.
- The higher-to-lower timeframe ratio commonly runs 4x to 6x, but that number matters less than clearly separating the roles of direction, levels, and trigger.
- Analysis must flow top-down — higher timeframe first, lower timeframe second. Looking at the lower timeframe first and rationalizing it against the higher timeframe invites confirmation bias.
- When the higher timeframe shows no clear direction, lower-timeframe signals become less reliable — that's the cue to switch to a range-specific approach rather than forcing a trend trade.