Trading Strategies · Lesson 87/87 · 8 min read
Fear & Greed Index Explained: Reading the 7-Factor Contrarian Sentiment Gauge
In this article
- One Number for "Is the Market Scared or Giddy Right Now?"
- The 7 Inputs That Build the Score
- Reading the 0-100 Score
- A Worked Example: What a Reading of 20 Actually Means
- Why Extremes Get Treated as Contrarian Signals
- Fear & Greed Index vs. PCR vs. VIX
- Don't Confuse It With the Crypto Version
- Practical Cautions
- Frequently Asked Questions
- Summary
One Number for "Is the Market Scared or Giddy Right Now?"
"Be fearful when others are greedy, and greedy when others are fearful" is probably the most quoted line in investing. The problem is always the same one: there's no clean way to tell, on any given day, whether the market is actually at one of those extremes or just having a loud news cycle. Forum chatter and headline tone are lagging and subjective — they tell you how people are reacting, not where sentiment actually sits relative to history.
CNN Business built the Fear & Greed Index to tackle that problem differently. Instead of relying on one signal, it blends seven indicators — spanning price momentum, volatility, options flow, and bond-market behavior — into a single 0-to-100 score. This lesson walks through exactly what goes into that score, how to read its five zones, and why it's risky to trade on its own. We'll also tie it back to two indicators already covered in this course: the put-call ratio (Lesson 60) and VIX term structure (Lesson 28), both of which are actually sub-components of this index.
The 7 Inputs That Build the Score
Per CNN's published methodology, each of these seven signals is converted to its own 0-100 reading and then averaged into the final index. The exact weighting and normalization details aren't fully disclosed, so it's safest to treat the inputs as "roughly equal contributors" rather than a precise formula you could replicate exactly.
| Component | What it measures |
|---|---|
| Stock price momentum | Where the S&P 500 sits relative to its 125-day moving average, and by how much |
| Stock price strength | Number of stocks hitting 52-week highs vs. 52-week lows on the NYSE |
| Stock price breadth | A McClellan Volume Summation-style measure of up-volume vs. down-volume |
| Put and call options | The put-call ratio — the same indicator family covered in Lesson 60 |
| Market volatility | Where the VIX sits relative to its own 50-day moving average |
| Junk bond demand | The yield spread between junk (high-yield) bonds and investment-grade bonds |
| Safe haven demand | Whether stocks or Treasury bonds delivered the better return over the trailing 20 trading days |
The table makes the core idea obvious: the Fear & Greed Index isn't generating new data from scratch. It's a roll-up of sentiment and positioning signals that already exist individually, compressed into one summary score. PCR and VIX are legitimate standalone indicators, but inside this index, they're just two of the seven ingredients.
Reading the 0-100 Score
Once the composite score lands, it's typically read against five bands. Worth flagging up front: these boundaries aren't a fixed rule CNN has locked in — they're the ranges most commonly cited across trading-education sources and data vendors.
| Score range | Zone | Typical read |
|---|---|---|
| 0-25 | Extreme Fear | Near-panic pessimism across the board — contrarians watch this as a potential buying zone |
| 25-45 | Fear | Below-average sentiment, often during an ongoing pullback |
| 45-55 | Neutral | No strong lean in either direction |
| 55-75 | Greed | Above-average optimism, commonly seen during sustained rallies |
| 75-100 | Extreme Greed | Excessive optimism and crowding — contrarians watch this as a potential overheating signal |
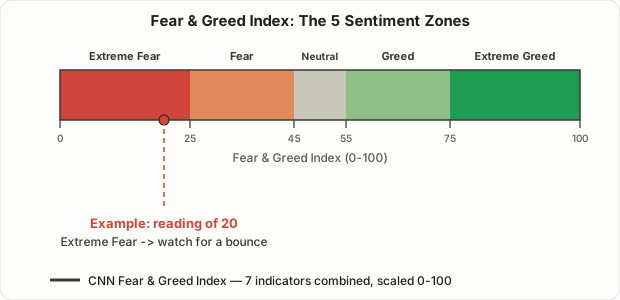
A Worked Example: What a Reading of 20 Actually Means
Picture a single trading day where the seven sub-scores come out like this (CNN computes the real thing internally — these are illustrative numbers to show the mechanics):
| Component | Sub-score (0-100) | What it's showing |
|---|---|---|
| Stock price momentum | 15 | S&P 500 trading well below its 125-day average |
| Stock price strength | 10 | New lows swamping new highs |
| Stock price breadth | 22 | Down-volume heavily outweighing up-volume |
| Put and call options | 18 | Put volume heavily outweighing call volume |
| Market volatility | 25 | VIX well above its 50-day average |
| Junk bond demand | 20 | High-yield spreads widening sharply |
| Safe haven demand | 30 | Treasuries clearly outperforming stocks over 20 days |
Average: (15+10+22+18+25+20+30)/7 ≈ 20 — squarely inside Extreme Fear. A reading like this only happens when all seven inputs are leaning pessimistic at once. Contrarians read this as: if no fresh bad news arrives, there may be relatively few new sellers left to push price lower, which is the structural basis for watching for a bounce.
Why Extremes Get Treated as Contrarian Signals
The logic isn't a gut feeling — it's structural. When all seven inputs lean sharply pessimistic simultaneously, it suggests a large share of market participants have already hedged or positioned short. In that state, even modest good news can trigger outsized short covering or bargain buying, simply because fewer sellers remain to act. The mirror case applies at extreme greed: most of the crowd that wanted upside exposure has likely already bought in, so a small negative surprise can trigger a pullback more easily.
This is not a mechanical "extremes always reverse" law. It's closer to "when a crowd leans heavily one way, fewer new participants remain to extend that lean further." The 2022 bear market is a clear counterexample — the index hit Extreme Fear readings on the way down, and the market kept falling for months afterward. An extreme reading means "this zone deserves attention," not "this is the bottom."
Fear & Greed Index vs. PCR vs. VIX
All three get casually labeled "fear gauges," but their scope is different.
| Fear & Greed Index | Put-Call Ratio (PCR) | VIX | |
|---|---|---|---|
| Scope | Composite of 7 signals | One options-market flow ratio | S&P 500 implied volatility |
| Relationship | Includes PCR and VIX as 2 of its 7 inputs | One input to the Fear & Greed Index | One input to the Fear & Greed Index |
| What it captures | Broad sentiment spanning momentum, breadth, and bond markets | Directional options positioning | Expected future price swings (direction-agnostic) |
| Related lesson | This lesson | Lesson 60: Put-Call Ratio | Lesson 28: VIX Term Structure |
PCR and VIX are literally "parts" of the composite. If the Fear & Greed Index reads Extreme Fear but PCR or VIX alone looks relatively mild, that's worth digging into — it usually means one of the other five components (breadth or junk-bond demand, for instance) is doing most of the pessimistic heavy lifting. Being able to decompose the score into its pieces is the real advantage this index has over watching any single input alone.
Don't Confuse It With the Crypto Version
There's a separate Crypto Fear and Greed Index built specifically for crypto markets. It shares the name but nothing else — it's calculated from Bitcoin volatility, trading volume, social media mentions, Google search trends, and market dominance, maintained by an entirely different provider. Treating the two as interchangeable, or comparing their readings directly, is a common and avoidable mistake.
Practical Cautions
- Never trade it as a standalone signal. Jumping to full position size the moment the index hits Extreme Fear is a common way to get run over. During the early stages of a real downtrend, the index can sit at Extreme Fear for weeks while it keeps falling. Wait for independent confirmation — a reversal candle, rising volume near support — before acting.
- Get in the habit of checking which component is driving the reading. Don't just look at the final score; check which of the seven inputs is pulling it to an extreme. If volatility alone is spiking while the rest look ordinary, that often points to a short-lived event shock rather than a broad sentiment shift.
- Pair it with a real strategy. The index doesn't tell you what to buy or where to enter. Combining it with the sizing discipline from Lesson 6 on risk-reward and money management — scaling in gradually at extremes rather than going all-in — is the more common practical approach.
- Duration matters more than a single print. A reading that stays pinned in an extreme zone for several sessions, and the direction it eventually breaks toward, is generally treated as more meaningful than one day's number in isolation.
Frequently Asked Questions
Should I buy the moment the index drops below 25?
No. 25 is a widely cited reference boundary, not a mechanical buy trigger. In the early stages of a downtrend, the index regularly sits below 25 for weeks while price keeps falling. Treat a reading in this zone as "pay closer attention," and pair it with actual price confirmation before acting.
Where can I check the Fear & Greed Index?
CNN Business publishes it live on its website — search "Fear & Greed Index" to see the current score along with each of the seven component readings, which update automatically as new data comes in.
Is it worth watching PCR and VIX separately, or is the composite index enough on its own?
Watching both is generally the better approach. The composite index is useful for a fast read on overall mood, but it won't tell you exactly why one input moved to an extreme. Checking PCR and VIX individually alongside it gives a clearer picture of what's actually driving the sentiment reading at any given moment.
Summary
- The Fear & Greed Index compresses seven signals — stock momentum, strength, breadth, the put-call ratio, VIX, junk bond demand, and safe haven demand — into a single 0-100 sentiment score.
- Readings of roughly 0-25 are read as Extreme Fear and 75-100 as Extreme Greed; contrarians watch these zones for potential reversals, but the boundary values are commonly cited conventions, not a fixed rule.
- The logic behind extremes is structural — a heavily one-sided crowd leaves fewer new participants to extend the move further — not a guarantee of an immediate reversal.
- The put-call ratio and VIX are two of this index's seven building blocks, so don't confuse the standalone PCR/VIX indicators with this composite reading of the same underlying data.
- The separate Crypto Fear and Greed Index uses entirely different inputs, and in every case, this is a supporting indicator to combine with price confirmation and other tools — never a standalone trade trigger.