Trading Strategies · Lesson 85/87 · 10 min read
Walk-Forward Analysis: How to Catch Backtest Overfitting (Curve-Fitting)
In this article
- Why Backtests Lie: What Curve-Fitting Actually Is
- Common Red Flags Worth Treating as Warning Signs
- What Walk-Forward Analysis Actually Does
- Simple Holdout vs. Walk-Forward Analysis
- A Worked Example: Splitting Ten Years of Data
- Scoring Consistency: Walk-Forward Efficiency
- What Walk-Forward Analysis Doesn't Fix
- A Practical Checklist
- FAQ
- Summary
Why Backtests Lie: What Curve-Fitting Actually Is
Almost every trader who builds their own system hits the same moment. You tweak a few indicator settings, run the backtest again, and suddenly the equity curve shoots up in an almost perfectly straight line. You go live with those exact settings, and within a couple of weeks the account is bleeding. That gap between a beautiful backtest and a disappointing live result has a name: curve-fitting, also called over-optimization, or in academic finance, data snooping.
The mechanism is simple once you see it. Take even a handful of adjustable inputs — a moving-average length, an RSI threshold, a stop-loss multiple — and the number of possible combinations explodes into the hundreds or thousands. Run all of them against the same stretch of historical data and keep whichever combination happened to score best, and what you've actually found isn't a repeatable pattern in the market. It's closer to the specific noise that existed in that one slice of history. It's the equivalent of studying with the answer key already in front of you: you'll ace that exact test, but the next one — live trading — asks completely different questions.
The ATR-based stop filters covered in Lesson 13 on risk filters, and the win rate and reward-to-risk inputs that feed Lesson 42's Kelly Criterion, are themselves numbers pulled out of historical data. If those numbers are already a product of curve-fitting, every risk rule and position-sizing formula built on top of them is navigating by a map that was drawn wrong in the first place. Walk-forward analysis is the standard way practitioners check whether that map is trustworthy before risking real capital on it.
Common Red Flags Worth Treating as Warning Signs
None of the items below prove a strategy is overfit on their own, but each is a widely cited signal worth checking before you trust a backtest.
| Red flag | Why it's suspicious |
|---|---|
| Five or more tunable parameters | More free parameters means more ways to accidentally land on a combination that fit the noise, not the signal |
| An unnaturally smooth equity curve | Real markets mix calm stretches with volatile ones; a near-straight line usually means the curve has been fit to one specific period |
| Hundreds or thousands of combinations tested, only the best one kept | The more attempts you make, the more likely one of them looks great purely by chance |
| Backtest window under 3-5 years, or covering only one regime (e.g. a single bull run) | A strategy that never saw a rate-hiking cycle, a sharp selloff, or a long flat chop will meet that regime for the first time with real money on the line |
| Performance swings wildly with tiny parameter changes | A genuine edge tends to hold up reasonably well across nearby parameter values; a spike at one exact setting suggests that value was fit to a coincidence |
Treat this table as a self-audit checklist before you trust a system, not a set of pass/fail rules.
What Walk-Forward Analysis Actually Does
There's no way to eliminate curve-fitting entirely, but walk-forward analysis is the most widely used technique for reducing it. The structure is straightforward:
- Split the full dataset into an in-sample window (for training) and an out-of-sample window (for testing).
- Optimize parameters using only the in-sample window — this is the data the strategy is allowed to "study."
- Apply those exact parameters, unchanged, to the next chunk of data the strategy has never seen — the out-of-sample window — and record performance there without touching the parameters again.
- Slide both windows forward in time and repeat steps 2-3 until you reach the end of the dataset.
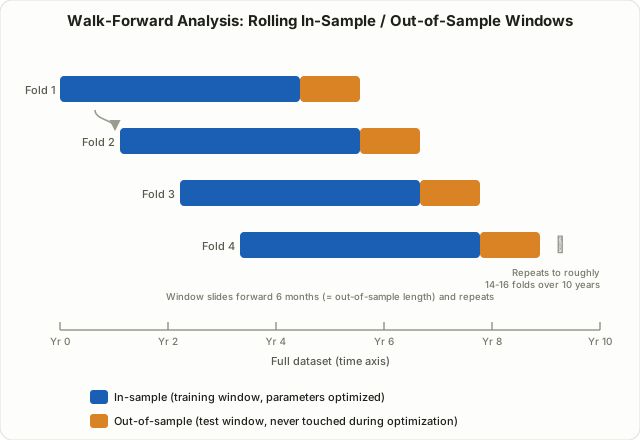
The core rule is this: the data used to choose parameters is never the same data used to judge performance. Parameters always come from the past window the strategy has already "learned" from; performance is always measured on a window the strategy has never been tuned against. That single separation is what makes walk-forward meaningfully harder to game than a plain backtest.
Simple Holdout vs. Walk-Forward Analysis
Walk-forward is often confused with a simpler technique: the holdout split, where you divide the data just once — say, the first 70% for training and the last 30% for testing. Both rest on the same basic idea (test on data you didn't train on), but they differ a lot in how much confidence they actually earn.
| Simple holdout (single split) | Walk-forward analysis (rolling split) | |
|---|---|---|
| Number of out-of-sample tests | One | Several (commonly 5 or more) |
| Regime coverage | Down to luck — the single test window might land entirely in one bull or bear phase | Sequentially passes through most of the regimes present in the full history |
| Can you judge consistency? | No — there's only one number | Yes — the spread of results across folds shows whether performance holds up or is lumpy |
| Computational cost | Low | Higher (re-optimizing once per fold) |
| Defense against "that was just luck" | Weak | Meaningfully stronger (though not bulletproof) |
A single holdout isn't worthless — it's a fine first-pass filter for quickly discarding obviously broken ideas. But for the decision that actually matters — whether to risk real money on a system — the consensus among practitioners is that a single test is far too thin a slice of evidence compared to the repeated, rolling validation walk-forward provides.
A Worked Example: Splitting Ten Years of Data
Here's a concrete, purely illustrative setup to make the mechanics tangible. These numbers describe a hypothetical setup, not an actual backtest result.
- Full dataset: 10 years of daily bars
- In-sample (training) window: 2 years
- Out-of-sample (testing) window: 6 months
- Step forward between folds: 6 months
With that configuration, fold 1 optimizes on years 1-2 and tests on months 24-30; fold 2 optimizes on years 1.5-3.5 and tests on months 30-36; and so on across the full ten years, producing roughly 14 to 16 out-of-sample test windows. You'll see rules of thumb floating around — something like "use 10-20 folds for high-frequency day-trading strategies, at least 5 for swing strategies" — but treat that as a widely repeated practitioner heuristic, not a number derived from a formal proof.
What matters more than the fold count is whether those folds actually span different market regimes. If ten years of history happens to skip any sharp volatility spike or extended sideways grind, slicing it into a hundred folds won't change the fact that the strategy is still meeting that kind of market for the first time once it's live.
Scoring Consistency: Walk-Forward Efficiency
Once the walk-forward run is done, you need one number that summarizes how the out-of-sample results compared to the in-sample results across every fold. The best-known metric here is Walk-Forward Efficiency (WFE), popularized by trading-system developer Robert Pardo.
WFE = average out-of-sample performance ÷ average in-sample performance × 100
If in-sample returns averaged 30% annually but out-of-sample averaged only 10%, WFE comes out to roughly 33%. If in-sample averaged 25% and out-of-sample 20%, WFE is 80% — a much smaller gap between what the strategy achieved on data it trained on versus data it hadn't seen. A low WFE is generally read as a sign the strategy leaned too heavily on quirks of the in-sample window, and a threshold around 50% shows up often in practitioner discussions as a rough cutoff for "reasonably robust." That 50% figure isn't an academically established standard, though — it's a commonly repeated rule of thumb, and should be treated as one.
For a more rigorous approach, researchers Marcos López de Prado and David Bailey have proposed statistical corrections like the Probability of Backtest Overfitting (PBO) and the Deflated Sharpe Ratio, which explicitly account for how many parameter combinations were tried before picking a "winner." These tools separate a result that merely looks good from one that's statistically likely to be a real edge. They involve meaningfully more statistics than walk-forward analysis, so it makes sense to treat them as a next step once walk-forward itself is second nature.
What Walk-Forward Analysis Doesn't Fix
Passing a walk-forward test is not a certificate of validity. At least three limitations are worth knowing up front.
First, walk-forward results aren't automatically free of selection bias. If you walk-forward test 50 different strategy variants and then cherry-pick the single one with the best out-of-sample result, that selection process itself reintroduces the exact bias walk-forward was supposed to guard against — choosing the best of many attempts is its own form of overfitting, one layer up.
Second, look-ahead bias is a separate problem entirely. If the backtest code accidentally uses information from the future — for example, generating today's signal from a closing price that technically isn't known yet when the signal fires — no amount of walk-forward structure will catch it, because the same error leaks into every single fold identically.
Third, walk-forward doesn't automatically account for real-world frictions like cross-position correlation or execution costs. A strategy trading many symbols at once can walk-forward cleanly on each symbol individually while still carrying correlated risk across the portfolio that a single-symbol test never surfaces.
A Practical Checklist
- Keep the parameter count as low as possible — every added parameter multiplies the number of ways a combination can fit noise instead of signal.
- Run walk-forward with at least 5 folds across the full dataset, and confirm the history actually includes distinct regimes (a sharp selloff, a long flat stretch, a strong trend).
- Record every fold's out-of-sample result separately, and compute a consistency metric like WFE to quantify the in-sample/out-of-sample gap.
- Log the total number of parameter combinations tried — you'll need that number later to judge whether a good result reflects a real edge or pure luck.
- Double-check that the execution assumptions in the backtest (fees, slippage — see Lesson 13) actually match what you'd get in live trading.
- Hold the line on one rule above all others: an out-of-sample window, once used for testing, never gets reused for optimization.
FAQ
If a strategy passes walk-forward analysis, is it guaranteed to make money live?
No. Walk-forward analysis is a validation process that reduces the risk of curve-fitting — it is not a guarantee of future profit. A genuine shift in market structure, or an event type that never appeared anywhere in the historical data, can still produce conditions the strategy has never faced.
Does more folds always mean a better test?
Not necessarily. Adding more folds shortens each out-of-sample window, which can leave each individual test with too small a sample to draw reliable conclusions from. Matching fold length to the strategy's trading frequency and the total data available matters more than simply maximizing the fold count.
Can a beginner run walk-forward analysis without a quant background?
Yes, either by coding it directly (a loop in Python is common) or by using the walk-forward tools built into many retail backtesting platforms. It helps to be comfortable with the reward-to-risk and sample-size basics from Lesson 6 first, since that makes it much easier to judge whether a walk-forward result is actually meaningful.
Summary
- Curve-fitting (over-optimization) happens when a strategy's parameters are tuned so tightly to historical data that they memorize that period's coincidental noise instead of a repeatable pattern.
- Walk-forward analysis splits data into in-sample (optimization) and out-of-sample (testing) windows and slides that pair forward through time, repeating the test on data never used for tuning.
- Compared to a single holdout split, walk-forward's repeated testing across multiple periods gives a far more reliable read on whether a strategy's edge is consistent.
- Metrics like Walk-Forward Efficiency summarize the in-sample/out-of-sample gap in one number, but specific thresholds (like 50%) are practitioner rules of thumb, not formal standards.
- Walk-forward analysis doesn't solve selection bias, look-ahead bias, or cross-position correlation on its own — it needs to be paired with other validation discipline, not used as the only check.