Trading Strategies · Lesson 81/81 · 7 min read
Pivot Point Trading Strategy: Classic, Woodie's, and Camarilla Formulas for Intraday Support/Resistance
In this article
What Pivot Points Are: Pre-Drawing Today's Levels From Yesterday's Data
A pivot point is a classic intraday tool that calculates support and resistance levels for today's session before the market even opens, using nothing but yesterday's (or last week's, or last month's) high, low, and close. The support/resistance concept covered in the support, resistance, and breakout lesson is something you identify by eye on a chart. Pivot points are different: the exact same fixed formula produces the exact same levels for everyone who uses it. The method dates back to floor traders in the early-to-mid 20th century, who had only a few minutes before the opening bell to hand-calculate a few key numbers on a calculator — which is why it's still sometimes called the "floor trader pivot."
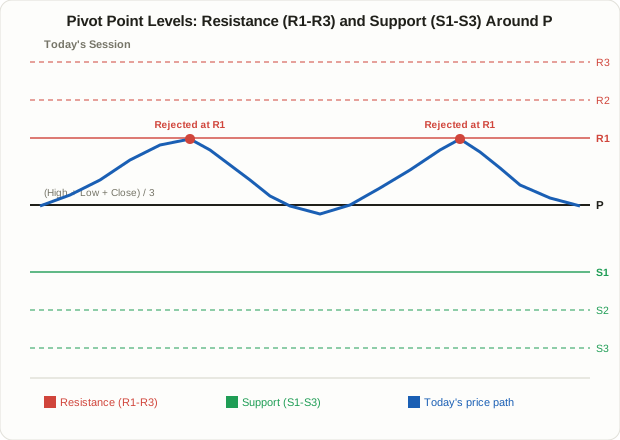
The core idea is simple. Take yesterday's price action and distill it into a single "center of balance" for today, the pivot (P), then mark off evenly-spaced levels above it (R1, R2, R3 — resistance) and below it (S1, S2, S3 — support). As a rough framework, price trading above P is read as a bullish tone for the session, and price below P as bearish.
The Formula: Classic (Standard) Pivot Points
The most widely used version is:
- P (central pivot) = (Prior High + Prior Low + Prior Close) ÷ 3
- R1 = (2 × P) − Prior Low
- S1 = (2 × P) − Prior High
- R2 = P + (Prior High − Prior Low)
- S2 = P − (Prior High − Prior Low)
- R3 = Prior High + 2 × (P − Prior Low)
- S3 = Prior Low − 2 × (Prior High − P)
A Worked Numeric Example
Say a stock's prior session printed a high of $52.00, a low of $48.00, and closed at $50.80:
- P = (52.00 + 48.00 + 50.80) ÷ 3 = 150.80 ÷ 3 = $50.27
- R1 = (2 × 50.27) − 48.00 = 100.53 − 48.00 = $52.53
- S1 = (2 × 50.27) − 52.00 = 100.53 − 52.00 = $48.53
- R2 = 50.27 + (52.00 − 48.00) = $54.27
- S2 = 50.27 − (52.00 − 48.00) = $46.27
If today opens at $50.50 — above the P of $50.27 — a range trader might plan to take profit (or go short) near R1 ($52.53) and look for a long entry near S1 ($48.53), with the whole ladder of levels mapped out before the first candle of the day even closes.
Three Formulas Compared: Classic vs. Woodie's vs. Camarilla
Pivot points come in a few different flavors depending on how the formula weights the closing price and how tightly the levels are spaced — and the differences matter for how each version actually gets used.
| Classic (Standard) | Woodie's | Camarilla | |
|---|---|---|---|
| Pivot (P) formula | (High+Low+Close)÷3 | (High+Low+2×Close)÷4 | (High+Low+Close)÷3 |
| Weight on close | Equal weight | Double-weighted | Equal weight (close anchors R4/S4) |
| Spacing between levels | Wide | Wide | Tight — levels cluster near the close |
| Typical use case | General intraday directional bias | Close-weighted short-term balance point | Precision entries/exits inside a range |
| Common application | R1/S1 as first profit target/support | Price above/below pivot sets the day's tone | Range-fade inside R3/S3; trend-follow on an R4/S4 break |
Camarilla's levels sit much closer together, clustered around the prior close, which is why it's often introduced as a dual-mode system: fade moves back toward the pivot while price stays inside R3/S3, but flip to trend-following the moment price breaks through R4 (or S4) with volume. Note that the exact multipliers used to build R4/S4 (some sources use 1.1 × range / 2, others closer to 1.5 × range) vary between charting platforms, so it's worth confirming which version your own software is actually plotting before trading off it.
How It's Traded: Range Fades and Breakouts
A distinctive feature of pivot points is that the same levels are used for two opposite strategies, and traders need to decide which regime they're in before acting.
- Range (mean-reversion) trading: On a day with no clear directional push, trade the pivot levels as if they'll hold — selling (or closing longs) near R1/R2 and buying near S1/S2. The logic is identical to the mean reversion lesson: treat a level as support/resistance and bet on a bounce when price touches it.
- Breakout trading: If price pushes through R1 decisively, on rising volume, that's read not as a bounce opportunity but as a sign the session has real directional strength, with R2 and R3 becoming upside targets. This is the same breakout-confirmation logic covered in the Donchian Channel and ORB lesson.
These two approaches aren't contradictory — the common practice is to read volume and price action at the moment price touches a level to decide which regime applies, then pick the strategy that fits. A common rule of thumb: if volume dries up and candles shrink right at the level, a range-fade reversal is relatively more likely; if the level gets taken out on an expansion in volume, continuation is relatively more likely. Neither is a guarantee — they're just the two most commonly cited tells.
Limitations to Keep in Mind
- Distorted on gap days: when earnings or major news causes today's open to gap far away from yesterday's close, the pivot levels — built entirely from yesterday's data — can sit in a price zone that has little to do with where the stock is actually trading today. Pivot reliability drops sharply on these days.
- Low-volume levels just get run through: in illiquid names or during quiet intraday hours, price frequently blows straight through R1/S1 without any reaction at all. A pivot level only flags where price might react — it's not a guarantee that it will.
- Weak as a standalone signal: most practical guides describe pivot levels as more reliable when combined with volume, candlestick confirmation, or overlapping support/resistance from other methods. Trading mechanically off a pivot touch alone is generally discouraged.
- The formula itself is convention, not law: there's no strong evidence that Classic, Woodie's, or Camarilla is categorically "better" than the others — they're widely used heuristics refined by trading communities over decades, not scientifically validated formulas. Picking one that fits your style and timeframe, then verifying its historical behavior on your own instrument, is the standard approach.
FAQ
Can pivot points only be used on daily charts?
No. The most common version is the "daily pivot," calculated from yesterday's data for today's session, but the exact same formula works with last week's high/low/close for a "weekly pivot," or last month's for a "monthly pivot." Swing and position traders tend to reference the weekly and monthly versions more often than the daily one.
Which formula should I use — Classic, Woodie's, or Camarilla?
It depends on your style. Classic or Woodie's tends to suit traders looking for a general directional read on the session, while Camarilla's tighter spacing is more often chosen for precision entries and exits within a defined range. None of the three is simply "wrong" — some traders even plot all three at once and treat zones where multiple formulas' levels cluster together (confluence) as stronger support/resistance than any single level alone.
How is this different from Fibonacci retracement?
Fibonacci retracement is anchored to a specific swing (a chosen high and low), so different traders can reasonably pick different swings and get different levels. Pivot points, by contrast, are calculated automatically from a fixed, unambiguous input — yesterday's (or last week's/month's) high, low, and close — so every trader using the same formula sees exactly the same numbers. That lack of subjectivity is one of the main reasons pivot points remain popular specifically for intraday trading.
Summary
- Pivot points pre-calculate a session's support and resistance levels (P, R1-R3, S1-S3) purely from the prior period's high, low, and close — no subjective chart-reading required.
- The Classic formula weights high, low, and close equally; Woodie's double-weights the close; Camarilla spaces its levels much more tightly, making it better suited to precision range trading.
- The same levels support two opposite approaches — fading a level in a range-bound session, or trend-following a decisive break of it — so reading volume and price action at the moment of contact matters more than the level itself.
- Reliability drops sharply on gap days and in illiquid names, so pairing pivot levels with volume or candlestick confirmation is the standard practice rather than trading off a bare touch.
- No single formula is objectively superior; the right choice depends on trading style and timeframe, and should be checked against an instrument's own historical behavior before being relied on.