Trading Strategies · Lesson 30/57 · 8 min read
Fibonacci Retracement & Extension Trading: Using the 38.2%-61.8% Golden Zone and 161.8% Profit Targets
In this article
Why Fibonacci Ratios Show Up on Price Charts at All
Fibonacci retracement is a charting tool that plots horizontal lines — typically at 23.6%, 38.2%, 50%, 61.8%, and 78.6% — across a prior price swing, giving traders a way to estimate how deep a pullback might go, and later, how far a resumed trend might run. The ratios come from the Fibonacci sequence (1, 1, 2, 3, 5, 8, 13, 21…), first popularized in the West by the 13th-century mathematician Leonardo Fibonacci. Divide any term in that sequence by the one before it and the result converges toward roughly 1.618; the inverse of that is roughly 0.618. That 0.618 (61.8%) is commonly called the "golden ratio," and a handful of related figures — 0.382, 0.5 (not strictly a Fibonacci ratio, but included by convention), and 0.786 (the square root of 0.618) — round out the standard toolset.
One thing worth being direct about upfront: while these ratios do show up repeatedly in nature, architecture, and mathematics, there's no scientific mechanism by which they should govern stock prices the way physical laws govern falling objects. The reason Fibonacci retracement carries real weight in markets isn't mystical — it's self-fulfilling, because a large share of traders and trading algorithms are all watching the same levels at the same time. When enough participants place buy orders clustered around the 61.8% level, that concentration of orders is itself what produces support there. Fibonacci retracement is less a prophecy and more a coordinate system that a critical mass of market participants happens to agree on.
How to Draw a Retracement
The mechanics are simple: you need one clean swing low and one clean swing high.
- Measuring a pullback in an uptrend: anchor the tool's start point at the swing low (0%) and the end point at the swing high (100%). The tool then plots 23.6%, 38.2%, 50%, 61.8%, and 78.6% as how far price has retraced back down from that high.
- Measuring a bounce in a downtrend: reverse it — anchor at the swing high (0%) and the swing low (100%).
The most common mistake is anchoring on an ambiguous swing. As covered in Lesson 4's Support/Resistance & Breakout Strategy, the swing points that matter are the ones that formed clear support or resistance — the kind of level a large number of other traders would also plausibly draw from. A retracement drawn from a vague, forgettable wiggle in price is a line nobody else is watching, which strips it of the self-fulfilling mechanism that gives it any predictive value in the first place.
The Golden Zone: 38.2% to 61.8%
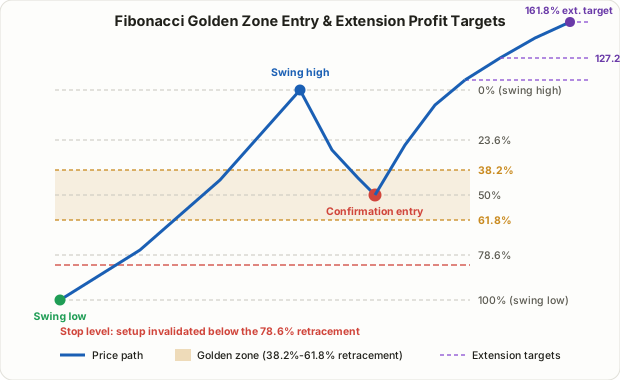
The entry zone used most widely in practice sits between 38.2% and 61.8% — commonly called the golden zone. A few reasons it's the default:
- A shallow pullback like 23.6% means the trend barely paused, which leaves very little room for a stop-loss — you get stopped out by ordinary noise far more often.
- A deep pullback like 78.6% puts price back near the original swing low, which raises the odds this isn't a pullback at all but an actual trend reversal.
- The 38.2%-61.8% band is the middle ground — enough of a rest to offer a reasonable stop distance, but not so deep that trend structure is already broken. It's the zone where a large share of traders conventionally look to re-enter.
It's worth being explicit here: none of this means price statistically has to bounce inside the golden zone. The 38.2%-61.8% preference is a widely shared market convention, not a validated statistical law, and it should be treated that way. The standard rule isn't to buy the instant price touches the zone — it's to wait for a confirmation signal inside that zone, such as a reversal candle (a hammer, a bullish engulfing bar) or a volume pickup, before entering.
A Worked Example: Calculating Retracement Levels
Suppose stock C rallies from a swing low of $40.00 to a swing high of $60.00 — a $20.00 move. Each retracement level is the high minus (the move × the retracement ratio).
| Retracement | Calculation | Price |
|---|---|---|
| 23.6% | $60.00 - ($20.00 × 0.236) | $55.28 |
| 38.2% | $60.00 - ($20.00 × 0.382) | $52.36 |
| 50% | $60.00 - ($20.00 × 0.5) | $50.00 |
| 61.8% | $60.00 - ($20.00 × 0.618) | $47.64 |
| 78.6% | $60.00 - ($20.00 × 0.786) | $44.28 |
If price pulls back from $60.00 and stalls somewhere between $52.36 and $47.64 (the golden zone), printing a reversal candle on the way, that zone becomes a long entry candidate. The stop goes near the 78.6% level ($44.28) or just below the most recent swing low beneath it. As covered in Lesson 6's Risk/Reward & Position Sizing, calculating the risk/reward ratio to your target — using the distance from entry to stop as the baseline — before you enter is not optional.
Fibonacci Extension: Setting Profit Targets
If retracement answers "how deep might this pullback go," Fibonacci extension answers "how far might the trend run once it resumes." It uses the same swing low-to-high anchor points as retracement, but projects levels past 100% — typically 127.2%, 161.8%, 200%, and 261.8%.
Continuing the example above, extension levels are the swing high plus (the original move × the extension ratio):
| Extension | Calculation | Price |
|---|---|---|
| 127.2% | $60.00 + ($20.00 × 0.272) | $65.44 |
| 161.8% | $60.00 + ($20.00 × 0.618) | $72.36 |
| 261.8% | $60.00 + ($20.00 × 1.618) | $92.36 |
If the entry was taken near $50.00 in the golden zone, a trader might plan a first scale-out at the 127.2% extension ($65.44) and a second at 161.8% ($72.36). In practice, 127.2% and 161.8% are the two extension levels used most often as first and second profit targets; reaching 261.8% is reserved for unusually strong trends. As with retracement levels, an extension target is a planning anchor, not a guarantee that price will actually reach it.
Confluence: Why Stacking Confirmations Matters
A Fibonacci level by itself is a thin reason to trade. It gets meaningfully stronger when it lines up with an independent piece of evidence — what's called confluence.
- A prior support/resistance price zone (from Lesson 4) that overlaps the golden zone
- A moving average (say, the 20-day or 50-day) passing through roughly the same area
- An Anchored VWAP support line from Lesson 17 sitting near the same level
Confluence like this means several unrelated methods of measurement all point to the same price — which is a meaningfully stronger case for an entry than any single method alone. Worth noting: Lesson 5's ICT Smart Money Concepts covers OTE (Optimal Trade Entry), which uses a 62%-79% retracement window — essentially the same golden-zone idea, adapted into the ICT framework's liquidity and market-structure vocabulary.
Common Mistakes and Limitations
- Drawing Fibonacci on every swing you see. Draw retracements on enough wiggles and you can retroactively claim "it worked" at almost any level. Reserve the tool for genuinely clean, structurally significant swings.
- Ignoring trend direction. Fibonacci retracement assumes a trend exists in the first place. In a choppy, range-bound market with no clear directional swing, the levels carry far less weight.
- Entering the instant price touches a level, with no confirmation. The golden zone is a candidate area, not a buy button. Entering purely because price touched 61.8%, with no reversal candle, no volume, and no confluence, produces a lot of avoidable stop-outs.
- Trading without a stop. If a pullback pushes past 78.6% toward 100%, that's a strong sign this was a trend reversal, not a pullback. A stop near or below 78.6% should always be in place before entry.
FAQ
Why is 61.8% called the "golden ratio"?
Because as you go further into the Fibonacci sequence, the ratio between consecutive terms converges toward roughly 1.618, and its inverse is roughly 0.618. That ratio has been observed repeatedly across architecture, art, and nature since antiquity, which is where the "golden" name comes from — but in markets, its significance comes from shared trader convention, not mathematical destiny.
Is Fibonacci retracement the same thing as ICT's OTE?
Conceptually, yes — very close. Both treat the 62%-79% zone of a swing as the preferred re-entry window. The difference is that OTE layers on ICT-specific structural confirmations, like a liquidity sweep or a fair value gap, on top of that zone. See Lesson 5's ICT Smart Money Concepts for the full picture.
Should retracements be drawn differently on different timeframes?
Yes. A retracement drawn on daily swings produces different levels than one drawn on 5-minute swings. A common approach is multi-timeframe: use a higher-timeframe retracement to define the broad entry zone, then wait for a confirmation candle on a lower timeframe within that zone.
Summary
- Fibonacci retracement (23.6%-78.6%) estimates how deep a pullback might go; extension (127.2%-261.8%) estimates how far a resumed trend might run.
- Always anchor on a clean, structurally meaningful swing low and high — an ambiguous swing produces a retracement nobody else is watching.
- The 38.2%-61.8% golden zone is the most widely used re-entry area, but entering on a level touch alone, without a confirmation signal, is a common and avoidable mistake.
- Extension targets (most often 127.2% and 161.8%) are commonly used for scaling out of a position — they're planning anchors, not guarantees.
- Confluence with other support/resistance, moving averages, or Anchored VWAP levels strengthens the case for any given Fibonacci zone.
- Always pair an entry with a stop near the 78.6% level, and treat Fibonacci levels as a reference tool, not a forecast.