Trading Strategies · Lesson 80/80 · 9 min read
Dual Momentum (GEM) Strategy: Combining Absolute and Relative Momentum to Allocate Between Stocks and Bonds
In this article
- An Asset-Allocation Strategy That Asks Only Two Questions a Month
- Two Kinds of Momentum: Absolute and Relative
- How the GEM Model Actually Runs
- Why It Works: Trend Persistence and Avoiding Tail Risk
- A Worked Numeric Example
- Absolute Momentum vs. Relative Momentum
- Common Variations Worth Knowing About
- Limitations and Caveats
- FAQ
- Summary
An Asset-Allocation Strategy That Asks Only Two Questions a Month
Most of the strategies covered so far in this course decide whether to buy or sell a single stock on a daily or weekly basis. The Dual Momentum strategy operates on a completely different cadence. Once a month, it asks the entire portfolio exactly two questions: "Is the stock market, as a whole, currently better than holding cash?" and "Among the stock markets available, which one is strongest right now?" The answers to those two questions, applied once a month, are all this systematic asset-allocation strategy needs to decide where your money sits.
The strategy was formalized by investment researcher Gary Antonacci in his 2014 book Dual Momentum Investing, and the concrete, tradeable model he laid out in it is known as GEM (Global Equities Momentum). Lesson 26's RRG Sector Rotation compares many sectors side by side and adjusts weightings over a few weeks to months — a tactical technique. Dual Momentum operates one level above that: it answers the bigger question of whether to be in stocks at all, re-evaluated once a month.
Two Kinds of Momentum: Absolute and Relative
The name "Dual Momentum" refers literally to combining two distinct types of momentum.
- Absolute Momentum: compares an asset's own trailing return against a risk-free benchmark (cash, or short-term T-bills). If the trailing 12-month return is positive and beats the cash return, the trend is considered "alive" and the asset is held; if not, the model moves to cash or bonds. This is essentially the same underlying logic as Lesson 20's Weinstein Stage Analysis avoiding stocks below their 30-week moving average — both share the philosophy of simply stepping aside once a downtrend is confirmed.
- Relative Momentum: compares several risky assets (e.g., US stocks vs. international stocks) against each other and picks whichever had the stronger trailing return. It's the same idea behind Lesson 2's Momentum Trading — "ride whatever is strongest" — applied at the level of entire markets instead of individual stocks.
Absolute momentum is the defensive gate that decides whether you should be exposed to stocks at all. Relative momentum is the offensive filter that decides, given you are exposed, which stock market to be exposed to. Applying both, in sequence, is the entire core of the GEM model.
How the GEM Model Actually Runs
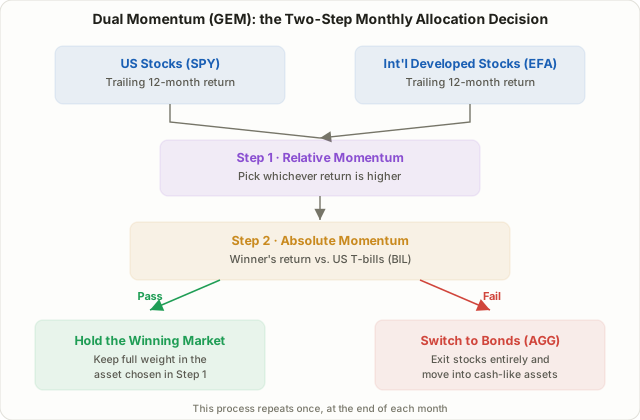
Antonacci's original GEM model typically uses three assets: US equities (the S&P 500, usually tracked via SPY), non-US developed-market equities (MSCI EAFE, usually tracked via EFA), and US bonds (usually AGG, with T-bills — BIL — standing in for the risk-free rate). At the end of each month, the decision runs in this order:
- Step 1 — Relative momentum: compare the trailing 12-month total return of US stocks (SPY) against international stocks (EFA) and note whichever is higher.
- Step 2 — Absolute momentum: check whether that winning asset's 12-month return also beats the return on T-bills (BIL).
- Allocation decision: if step 2 passes, hold the stock market selected in step 1 in full. If it fails, exit stocks entirely and move the whole position into bonds (AGG).
💡 The 12-month lookback is the most widely cited and most frequently tested convention from Antonacci's book, but it is not a fixed law. A shorter window, like one month, overweights very recent moves and is more vulnerable to short-term reversals; a much longer window, like 36 months, reacts too slowly to real trend changes. In practice, 6 to 12 months is the range most commonly tested — and that range itself is a widely used convention, not a rule that must be followed exactly.
Why It Works: Trend Persistence and Avoiding Tail Risk
Dual Momentum leans on two genuinely distinct market properties.
The first is medium-term momentum persistence. Starting with Jegadeesh and Titman's 1993 study, researchers have repeatedly observed, across many markets and asset classes over several decades, that assets which outperformed over the prior 3 to 12 months have tended to keep outperforming in the near term that follows. Academics haven't settled on a single agreed cause, but commonly cited behavioral explanations include investor underreaction to new information, and feedback loops where early gains attract further buying.
The second is absolute momentum's role as a tail-risk filter. Most of the stock market's cumulative losses tend to concentrate in a small number of severe drawdown periods, and those periods typically show up as prices spending an extended stretch below their trend. The absolute momentum check is specifically designed to catch that "the trend has broken" state and step aside before the damage compounds further. It won't dodge every single decline, but during drawn-out bear markets like 2008 or the early-2000s dot-com collapse — ones that unfold over many months rather than a single violent day — the signal has historically tended to flip to cash relatively early, which is the core appeal of the approach.
A Worked Numeric Example
Here's a simplified walkthrough of the decision process. Suppose, at the end of some month, trailing 12-month total returns look like this:
| Asset | Example ticker | Trailing 12-month return |
|---|---|---|
| US stocks | SPY | +14.2% |
| International developed stocks | EFA | +8.5% |
| US T-bills | BIL | +4.8% |
| US bonds | AGG | +2.1% |
Step 1 (relative momentum) picks SPY (+14.2%) over EFA (+8.5%) as the stronger candidate. Step 2 (absolute momentum) checks SPY's return against BIL: 14.2% is well above 4.8%, so it passes. The model allocates the entire portfolio to SPY (US stocks) for the month.
Now suppose conditions shift the following month: SPY's trailing 12-month return drops to -3.0%, while BIL still sits around +4.5%. This time the absolute momentum step fails outright (-3.0% < 4.5%). At that point it no longer matters which stock market was relatively less bad — the GEM rule is to move the entire position into AGG (bonds) regardless. That's the role absolute momentum plays: it stops the model from stubbornly holding "the least-ugly stock market" once stocks as a whole have turned down.
Absolute Momentum vs. Relative Momentum
| Absolute Momentum | Relative Momentum | |
|---|---|---|
| What's compared | An asset's own return vs. a risk-free benchmark (cash) | Several risky assets' returns, compared to each other |
| Question answered | "Should I be in the stock market at all right now?" | "Given I'm in stocks, which market is strongest?" |
| Primary job | Avoiding drawdowns, managing tail risk | Picking the stronger asset during uptrends |
| Weakness alone | In a strong bull market, it just tracks the market with no selectivity | Can't avoid losses when every risky asset is falling together |
| Role within GEM | Step 2 — the final filter | Step 1 — candidate selection |
As the table shows, the two forms of momentum cover for each other's blind spots. Relative momentum alone, used in 2008, would have kept holding "whichever equity market fell less" straight through a period when every equity market was falling — producing no real protection. Absolute momentum alone gives no basis for choosing between markets during an uptrend, collapsing into plain market-following. Combining both is what produces the complete logic: ride the strongest market while trends hold, and step into cash-like assets once the trend clearly breaks.
Common Variations Worth Knowing About
The original GEM model is deliberately simple — three or four assets, one rule set. In practice, several variations come up often: adding emerging-market equities (EEM) as another relative-momentum candidate, or stretching the rebalancing interval from monthly to quarterly to cut down trading frequency. Academically, Wouter Keller's follow-on work on models like PAA (Protective Asset Allocation) is frequently cited alongside Dual Momentum as an extension that adds more asset diversification and applies more conservative downside protection rules. These variants rest on different assumptions and were tested over different periods, though, so GEM's own backtested results shouldn't be assumed to carry over to them directly — and added complexity generally raises the risk of overfitting to the specific history being tested.
Limitations and Caveats
- It struggles in choppy, whipsaw markets. When a market moves sideways without a clear direction, the absolute momentum signal can flip back and forth repeatedly, buying high and selling low in succession. This is a weakness shared by nearly every trend-following system, not something unique to Dual Momentum.
- A once-a-month signal is slow inside a fast crash. When a sharp decline and a sharp rebound both happen within the same month — as in March 2020 — the model can absorb most of the drawdown before its next signal even fires. Monthly rebalancing is built to catch gradual, long-running trend changes, not single-day shocks.
- Past performance doesn't guarantee future results. The long-run backtest figures published in Antonacci's book reflect one specific historical period and asset combination, and often exclude trading costs, taxes, and currency effects. Lesson 13's ATR and Net-Profit Risk Filters makes the same point in a different context: always confirm an edge survives after costs, not before them.
- Taxable accounts feel the trading costs more. Because the model switches entire positions rather than trimming at the margins, each switch can realize a taxable gain. Running GEM inside a tax-advantaged retirement account versus an ordinary taxable brokerage account can produce meaningfully different real-world returns even with identical signals.
FAQ
Is Dual Momentum a short-term trading strategy or a long-term one?
It's much closer to a long-term asset-allocation strategy. Decisions and rebalancing happen once a month, which puts it on a completely different time scale from the short-term momentum and breakout strategies covered elsewhere in this course. That said, the underlying logic — "step aside once the trend breaks" — is philosophically the same idea as a stop-loss rule in short-term trading, just applied monthly instead of intraday.
Do I have to use the exact SPY/EFA/BIL combination?
No. That combination is simply the best-known version from Antonacci's book. The same logic can be applied to other asset pairs — domestic versus international equities, or a set of sector ETFs against each other, for example. The more similar in risk profile the compared assets are, the more meaningful the comparison; mixing assets with very different risk characteristics makes the signal harder to interpret.
How is this different from RRG sector rotation?
Lesson 26's RRG is a tactical, visual tool for comparing many sectors or stocks against each other at once, typically re-evaluated on a shorter cycle. Dual Momentum compares far fewer candidates (usually two to four asset classes), re-evaluates only monthly, and adds an absolute-momentum check against cash that RRG doesn't have. It sits a level higher — a more conservative, broader asset-allocation framework rather than a sector-timing tool.
Summary
- Dual Momentum (GEM) decides monthly stock-versus-bond allocation by applying relative momentum (pick the strongest of several risky assets) followed by absolute momentum (confirm that asset still beats cash) in sequence.
- Gary Antonacci formalized the approach in his 2014 book; the original GEM model rotates monthly among US stocks (SPY), international stocks (EFA), and bonds (AGG/BIL) using trailing 12-month returns.
- The strategy rests on two distinct mechanisms: medium-term momentum persistence, observed across decades of research, and absolute momentum's function as a tail-risk filter against extended drawdowns.
- Absolute and relative momentum cover each other's blind spots; using only one of the two loses either the ability to pick a strong asset in an uptrend or the ability to step aside in a broad downturn.
- Repeated whipsaw losses in choppy markets, slow reaction inside fast single-month crashes, and real-world trading costs and taxes are structural limitations to weigh before applying this strategy — and the 12-month lookback itself is a widely used convention, not a fixed rule.