Trading Strategies · Lesson 59/59 · 7 min read
Vanna and Charm Exposure: How Dealer Hedging Drives the End-of-Day Options Pin
In this article
- The Two Greeks Behind "Mysterious" Grinding Rallies
- Delta Isn't Fixed — It Also Reacts to Volatility and Time
- Vanna: The Mechanics Behind the Volatility-Reset Rally
- Charm: The Clock That Pins the Close
- A Hypothetical Walk-Through: Why Delta Shifts Even When Price Doesn't
- Vanna-Driven Moves vs. Charm-Driven Moves
- How Traders Use This in Practice
- Limitations and Caveats
- FAQ
- Summary
The Two Greeks Behind "Mysterious" Grinding Rallies
You've probably noticed the market quietly melt higher on a slow, low-news afternoon, or watched an index glue itself to a round strike in the final hour before expiration. Lesson 15 covered gamma exposure (GEX) — the hedging flow created by how fast an option's delta changes as price moves. But price isn't the only thing that moves delta. Implied volatility (IV) changes it too, and so does the simple passage of time. Those two effects have names: vanna and charm. Once you understand them, a lot of otherwise "random" grinding rallies and expiration-day pins stop looking random.
Delta Isn't Fixed — It Also Reacts to Volatility and Time
Every option's delta responds to more than just the underlying's price. Vanna measures how delta changes as implied volatility changes; charm (sometimes called delta decay) measures how delta changes as time passes, all else equal. Both are "second-order" Greeks built on top of delta, the same way gamma is — but where gamma is driven by price, vanna is driven by volatility and charm is driven by the calendar. Options market makers who sell options and delta-hedge the resulting exposure (the same dealers from the GEX lesson) have to rebalance their hedges not just when price moves, but whenever IV shifts or a trading day ends — even if the underlying hasn't budged at all.
Vanna: The Mechanics Behind the Volatility-Reset Rally
A commonly cited framework among options-flow analysts starts from an assumption about typical dealer positioning: because retail and institutional flow skews toward buying downside protection (put buying) and, more broadly, dealers end up net short out-of-the-money puts and net long out-of-the-money calls across a lot of index option activity, their aggregate book carries positive vanna. Under that assumption, here's the mechanical chain:
- Implied volatility falls (fear subsides after an event, or into a quiet holding period) → the delta on that dealer book shifts in a way that requires buying the underlying to stay hedged → that buying pushes price up → a calmer, higher market often pushes IV down further → the loop repeats.
- Implied volatility rises (a shock, a surprise headline) → the same book requires selling to stay hedged → that selling adds to downward pressure right when the market is already nervous.
This is the mechanism traders point to when they describe a "volatility-reset rally" or a "low-vol melt-up" — a grind higher with no clear news catalyst, often starting a day or two after a VIX spike fades. It's also why sharp volatility spikes can feel self-reinforcing on the way down, not just the way up.
Charm: The Clock That Pins the Close
Charm works on a different clock. As expiration approaches, an option's delta naturally decays toward its terminal value — 0 for options that finish out-of-the-money, 100 (or -100) for options that finish in-the-money. Dealers hedging a large book of near-dated options have to trim or add to their hedge continuously just to keep pace with that decay, independent of any price move.
Two windows matter most:
- Overnight, into the open. Markets are closed while charm keeps decaying delta. Dealers arrive at the open already needing to rebalance for a full session's worth of accumulated decay, which can create a systematic lean toward buying or selling right at the bell.
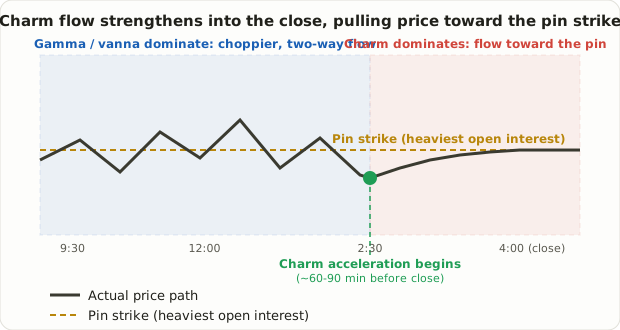
- The final 60–90 minutes before the close, especially near monthly and quarterly OPEX (options expiration) and on heavy same-day (0DTE) expiration days. Charm accelerates sharply as expiration nears because gamma itself is largest for at-the-money options right before they expire. That accelerating decay is a major contributor to the "end-of-day pin" — price gravitating toward the strike with the heaviest open interest into the closing bell.
A Hypothetical Walk-Through: Why Delta Shifts Even When Price Doesn't
This is an illustrative example to show the mechanism, not a real backtest statistic. Say an index sits at 5,000 with heavy open interest at the 5,000 strike expiring that same day (0DTE). At 9:30 AM, the at-the-money 5,000 call carries a delta near 0.50 — a dealer short a large block of these needs to hold roughly half a share of underlying-equivalent exposure per contract to stay hedged.
If the index is still sitting almost exactly at 5,000 at 3:00 PM, that call's delta hasn't stayed at 0.50 — pure time decay (charm) has pulled it noticeably higher, often well above 0.65–0.70 for a same-day option with only an hour of life left, simply because so little time remains for the option to end up out-of-the-money. The dealer who sold that call now needs meaningfully more hedge than they did that morning, purely from the clock running down — not from any price move. Multiply that shift across the full open interest at that strike, and you get a real, mechanical buying or selling flow concentrated in the final hour, which is exactly the kind of flow that produces the pin.
Vanna-Driven Moves vs. Charm-Driven Moves
| Vanna | Charm | |
|---|---|---|
| What triggers the flow | A change in implied volatility | The passage of time toward expiration |
| Typical time window | Anytime IV shifts meaningfully (post-event, into a quiet stretch) | Overnight-to-open, and the final 60–90 minutes before the close |
| Common pattern it's linked to | Low-vol melt-up rallies; acceleration of vol-spike selloffs | Morning drift at the open; end-of-day pin near heavy open interest |
| Strongest near | No fixed calendar window — depends on IV regime | Monthly/quarterly OPEX and heavy 0DTE days |
How Traders Use This in Practice
Like GEX, vanna and charm aren't standalone buy/sell signals — they're context for what kind of hedging flow is likely to be running in the background.
| Situation | Common interpretation |
|---|---|
| IV has just dropped sharply after an event | Watch for a possible vanna-driven grind higher over the following sessions, absent new negative catalysts |
| Final hour of a session with heavy 0DTE open interest at a nearby strike | Charm flow toward that strike tends to intensify — a setup some traders treat with caution for new momentum entries, similar to the max pain concept |
| Large monthly/quarterly OPEX approaching | Both vanna and charm flows can shift abruptly as expiring open interest rolls off, making the prior pattern less reliable right around that date |
Limitations and Caveats
- Dealer positioning is inferred, not published. Just like GEX, vanna and charm estimates rest on assumptions about dealer positioning that data providers back out from public open interest — real positioning can differ.
- It's a second-order effect layered on top of gamma. Vanna and charm flows are real but usually smaller in magnitude than straightforward gamma-driven hedging; treat them as an additional lens, not a replacement for the gamma picture from Lesson 15.
- News overwhelms structure fast. An earnings surprise or macro headline can blow through whatever pin or drift the options structure implied, without much resistance.
- 0DTE has amplified both effects. Because gamma and charm both grow sharply as expiration nears, the explosive growth in same-day expiring contracts on major indices has made these flows larger and faster-moving than they were even a few years ago.
FAQ
Is vanna/charm exposure the same thing as gamma exposure (GEX)?
No, though they're related. All three are hedging flows created by options market makers rebalancing delta. Gamma tracks how delta reacts to price, vanna tracks how it reacts to implied volatility, and charm tracks how it reacts to time. They can reinforce or offset each other, which is why serious options-flow analysis usually looks at all three together rather than any one in isolation.
Can retail traders actually access vanna and charm data?
A handful of options-flow data providers now publish vanna and charm exposure charts alongside GEX, typically for major indices and the most liquid single names. Raw open interest and implied volatility surfaces needed to compute it yourself usually require a paid data feed.
Does charm only matter for 0DTE options?
No, but it matters most there. Charm exists for any option and grows as expiration approaches for every contract, but because it accelerates sharply in an option's final days, its effect is most visible and most tradable around same-day expirations and around monthly/quarterly OPEX, when open interest at nearby strikes is largest.
Summary
- Vanna measures how an option's delta changes as implied volatility changes; charm measures how delta changes as time passes toward expiration — both are second-order Greeks that sit alongside gamma.
- Under the commonly cited dealer-positioning assumption, falling IV triggers vanna-driven buying (a "volatility-reset rally"), while rising IV triggers vanna-driven selling that can accelerate a selloff.
- Charm decays delta continuously; the effect concentrates overnight into the open and, especially, in the final 60–90 minutes before the close near OPEX and heavy 0DTE days, contributing to the "end-of-day pin."
- Both are best treated as context for likely background hedging flow, layered on top of the gamma picture, not as standalone directional signals.
- Dealer positioning behind these estimates is inferred from public open interest, not disclosed, and strong news catalysts can overwhelm the structural pull at any time.