Trading Strategies · Lesson 89/89 · 8 min read
VWAP Standard Deviation Bands: Band Fade (Mean Reversion) vs. Band Break (Trend Following)
In this article
A Band Width That Moves With the Day's Own Volatility
Lesson 10's Four Mean-Reversion Variants used a fixed percentage — "price has drifted more than 0.3% from session VWAP" — as the trigger for a VWAP reversion trade. Lesson 17's Anchored VWAP moved the starting point of the VWAP calculation away from the session open to a trader-chosen event. This lesson changes a different variable: instead of asking "how far is far enough" with a fixed percentage, VWAP standard deviation bands define "far" using the day's actual measured volatility.
A 0.5% deviation means something completely different on a quiet range day than it does during a volatile trend day. Standard deviation bands solve that by widening and narrowing automatically, session by session, based on how dispersed the actual trades were. This is one of the more commonly plotted overlays among futures scalpers and prop-firm day traders, usually sitting right alongside plain session VWAP on the chart.
How the Bands Are Actually Calculated
VWAP itself is unchanged from earlier lessons — the running sum of (price × volume) divided by cumulative volume. The bands add one extra step: for every trade, you measure how far that price sits from the running VWAP, weight that deviation by the volume of the trade, compute the resulting (volume-weighted) standard deviation (σ), and then plot lines at 1σ, 2σ, and 3σ above and below the VWAP line itself.
| Band | Position | Common Interpretation (under a normal-distribution assumption) |
|---|---|---|
| ±1σ | One standard deviation from VWAP | The edge of the "normal" range — the band price touches most often during the day |
| ±2σ | Two standard deviations from VWAP | The zone mean-reversion traders typically watch as "overbought/oversold" |
| ±3σ | Three standard deviations from VWAP | An extreme zone, usually only reached during a genuinely strong trend day |
One thing worth being explicit about: the commonly cited "~68% of outcomes fall within ±1σ, ~95% within ±2σ" figures come from the theoretical normal distribution, not from any guarantee about how intraday prices actually behave. On trend days and around news releases, the distribution of trades skews hard in one direction, and those percentages stop applying in any literal sense. Treat them as a rule-of-thumb reference for roughly how the bands space out, never as a fixed probability law that "price reverts 95% of the time outside 2σ."
Two Opposite Mechanisms Make the Bands Meaningful
Standard deviation bands carry signal for two genuinely different, and somewhat contradictory, market reasons. Mixing them up is the most common way traders misuse this tool.
- The mean-reversion case: the fact that most of today's volume traded near VWAP means that price level is roughly where buyers and sellers agreed most often today. When price pushes out to 2σ, relatively few participants have actually transacted at that level, and both algorithms and discretionary traders tend to read that as "overextended," placing orders in the opposite direction.
- The trend-following case: on the other hand, during a strong news day or a session with heavy institutional flow in one direction, price methodically punching through band after band is itself the signal — it means the order flow is strong enough to simply ignore the statistical average. On days like that, the bands measure trend strength, and traders waiting for a reversion back toward VWAP are the ones who end up losing money.
In other words, the bands alone don't tell you whether you're looking at a fade setup or a breakout setup. You need additional context — volume, the day's overall regime, and the width of the bands themselves — to make that call.
Band Fade vs. Band Break: Side-by-Side Rules
| Band Fade (Mean Reversion) | Band Break (Trend Following) | |
|---|---|---|
| Best regime | Range-bound, no major catalyst | Trend day, right after news or earnings |
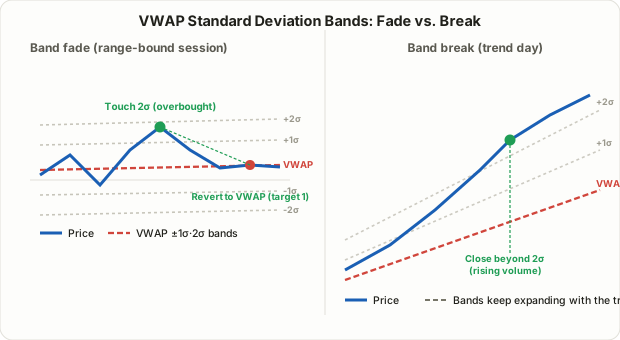
| Entry trigger | Touch the 2σ band, then a reversal candle back toward VWAP (fading volume) | Close beyond the 2σ band on rising volume |
| Stop placement | Just outside the 3σ band | Back at VWAP, or at re-entry inside the 1σ band |
| First target | VWAP (the centerline) | One band-width (1σ) of further extension |
| Second target | The opposite 1σ band | The 3σ band, or a trailing stop |
| Failure signal | No reversal — price keeps grinding out to 3σ (possible regime change) | Price closes back inside VWAP right after the break (false breakout) |
In practice, the simplest filter for choosing between the two is the width of the bands themselves. If the bands are tight and price has been oscillating inside them for a while, the fade side has the edge. If the bands are already wide at the open and continuing to expand in one direction, the break side usually has the edge. Don't lock yourself into treating either approach as "always correct" — build the habit of checking the band width and the first 30 minutes of price action each session before deciding which regime you're actually trading.
A Worked Numeric Example
Suppose stock C trades through five simplified price/volume snapshots over the day:
| Time | Price | Volume (shares) | Price × Volume |
|---|---|---|---|
| 09:30 | $50.00 | 200,000 | $10,000,000 |
| 10:00 | $50.30 | 150,000 | $7,545,000 |
| 11:00 | $50.60 | 180,000 | $9,108,000 |
| 13:00 | $50.20 | 160,000 | $8,032,000 |
| 14:30 | $50.80 | 220,000 | $11,176,000 |
Cumulative volume is 910,000 shares and cumulative (price × volume) is $45,861,000, so VWAP = $45,861,000 ÷ 910,000 ≈ $50.398.
Next, weight each price's deviation from VWAP by that bar's volume to get the variance: summing volume × (price − VWAP)² across all five snapshots gives roughly $82,291,640 (in squared-cent units scaled to this example), and dividing by cumulative volume (910,000) gives a variance of about 90,431, or a standard deviation (σ) of roughly $0.301.
So, at this point in the session, the bands sit at:
- VWAP: $50.398
- +1σ / −1σ: $50.699 / $50.097
- +2σ / −2σ: $51.000 / $49.796
If price pushes up toward $51.00 (the 2σ band) after 14:30 and then prints a reversal candle back toward VWAP on fading volume, that's a band-fade setup. If price instead closes above $51.00 on rising volume, that reads as a band-break setup instead. A real platform recalculates this on every single trade tick rather than five snapshots, but the underlying math is identical.
FAQ
How is this different from Bollinger Bands?
Lesson 14's Bollinger Bands are built on a simple moving average (SMA), with standard deviation measured against that line over a fixed lookback window. VWAP bands use the volume-weighted average price itself as the centerline, and volume is baked directly into the deviation calculation — meaning price levels where heavier volume traded carry more weight. Bollinger Bands also keep rolling forward over a fixed number of past bars, while VWAP bands typically restart fresh every session (or at whatever anchor point you choose).
Do I have to use exactly 1σ/2σ/3σ?
No. Those multiples are simply the most common convention, not a fixed rule. Plenty of traders use 1.5σ or 2.5σ depending on a given instrument's typical volatility or the style of strategy they're running. There's no single "correct" multiplier — the only way to know what fits a specific ticker and session is to check historically how often a given multiple gets touched versus barely reached at all.
Should I use session VWAP bands or anchored VWAP bands?
It depends on your timeframe. For intraday scalping and day trading, the session VWAP bands that reset every morning are the right tool. If you're working within a swing trend and want a wider support/resistance read over a longer window, you can apply the same standard-deviation-band logic to the Anchored VWAP from Lesson 17 instead. Both use the same formula — the only difference is how often the clock resets.
Limitations and Caveats
- The percentages assume a normal distribution. As noted above, the ~68%/~95% figures tied to ±1σ/±2σ are theoretical reference points, not a guarantee about how actual intraday prices are distributed.
- Misreading the regime costs you both ways. Running a fade strategy on a genuine trend day, or a breakout strategy inside a range-bound session, both tend to lose money. Check how fast the bands are expanding early in the session before committing to either approach.
- Bands are unstable right after the open. With little cumulative volume behind the calculation, band width can swing erratically in the first 15–30 minutes. Many traders treat early signals conservatively or skip them outright.
- Low-liquidity names are less reliable. With thin volume, a handful of trades can distort both the VWAP and the variance calculation, so the bands stop reflecting any genuine "average participant" behavior.
- Never trade the bands in isolation. A band touch or a band break is one piece of evidence, not a complete trade plan — always pair it with a defined stop-loss.
Summary
- VWAP standard deviation bands use the volume-weighted standard deviation (σ) of price around VWAP to size the bands dynamically, based on the actual volatility of that specific session.
- Where Lesson 10's session VWAP reversion strategy used a fixed percentage, this lesson redefines the same idea using the day's own measured volatility instead.
- Band fade (mean reversion) looks for a reversal after touching the 2σ band during range-bound conditions; band break (trend following) follows a volume-backed close beyond the 2σ band during a trend day. Decide which regime you're in from the band width and early session behavior before picking a side.
- The 68%/95% figures tied to ±1σ/±2σ are normal-distribution reference points, not a guaranteed probability law.
- Account for distortion near the open and reduced reliability on low-liquidity names, and always combine this with a defined stop as a confirming tool rather than a standalone signal.