Trading Strategies · Lesson 17/57 · 7 min read
Anchored VWAP Strategy: Finding the Real Average Cost Basis From Any Starting Point
In this article
Starting From a Limitation of Session VWAP
Lesson 10's Four Mean-Reversion Variants covers a VWAP deviation-reversion strategy built on the session VWAP — a line that starts calculating the instant the market opens and resets every night. That makes it a strictly intraday tool. But what traders often actually want to know isn't "what's the average fill price today," it's "since this move started, what's the average cost basis of everyone holding this stock?" Answering that question means letting the trader choose the starting point (the "anchor") instead of forcing it to be the session open — and that's exactly what Anchored VWAP (AVWAP) does.
The formula behind Anchored VWAP is identical to ordinary VWAP: the running sum of (price × volume) from the anchor point to now, divided by cumulative volume over that same window. The only difference is where the clock starts. That one change turns VWAP from a day-trading-only tool into something usable across swing and position trading timeframes as well.
Why a "Cost Basis" Line Behaves Like Support or Resistance
Anchored VWAP isn't a mystical predictive line — it works because of how the people who actually hold shares from that anchor point tend to behave.
- Suppose a rally started at a clear swing low and has been climbing since. The Anchored VWAP from that low is, roughly, the average price everyone who bought during that rally paid.
- When price pulls back down to that Anchored VWAP line, some of those original buyers are inclined to add to their position "near breakeven," while traders who missed the initial move often see it as "a chance to get in at the same price as the average participant."
- Both of those behaviors tend to concentrate buying interest right around the Anchored VWAP line, which is why it frequently acts like support. The same logic works in reverse as resistance during a downtrend.
In other words, Anchored VWAP isn't predicting the future — it's calculating the average psychological reference price of a large group of participants and displaying it. Once you internalize that mechanism, it becomes clear why choosing the right anchor point matters more than almost anything else in this strategy.
Choosing an Anchor Point
Using Anchored VWAP in practice comes down to answering one question: where should the clock start? Commonly used anchor points include:
| Anchor Point | What It Represents | Typical Use Case |
|---|---|---|
| A clear swing high/low | Average cost basis since a trend reversal began | Confirming support/resistance on a pullback entry |
| The open following an earnings report | The point new fundamental information started getting priced in | Trend-following after an earnings gap |
| A major news or event candle | A structural shift in the stock's story | Judging direction after a catalyst |
| Start of year/quarter | Institutional portfolio rebalancing reference | A longer-term positional reference line |
| A high-volume breakout candle | Average cost basis of a large capital inflow | Confirming support after apparent accumulation |
The key point is that an arbitrary anchor produces an arbitrary, meaningless line. Anchoring at "30 days ago" for no particular reason offers nothing over a plain session VWAP. The anchor needs to be a structural turning point that a meaningful share of market participants actually reacted to — only then does the line approximate the real average cost basis of a large group, and only then does it carry any weight as support or resistance.
Two Core Entry Patterns: Pullback Bounce and Initial Break
Anchored VWAP is used in practice in two main ways.
1. Pullback bounce entry
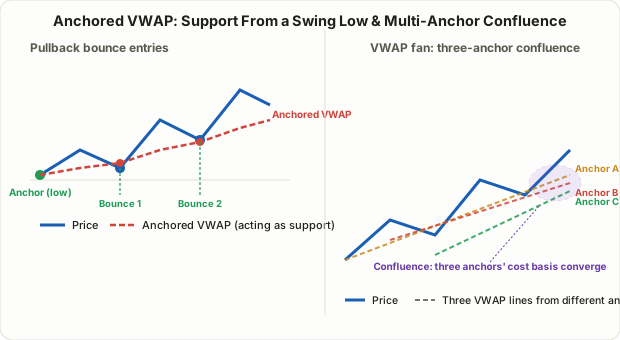
Assume an uptrend is already underway and the Anchored VWAP, calculated from the swing low that started it, has been rising underneath price the whole way. When price pulls back down to touch that line without closing meaningfully below it, and then prints a candle back above it, that's read as an entry signal. The stop goes just below the Anchored VWAP (or below the most recent swing low beneath it). Structurally this is the same pattern as the EMA pullback re-entry covered in Lesson 9's Trend Pullback Strategy — the only change is swapping a moving average for a volume-weighted cost-basis line.
2. Initial break entry
This uses the direction price takes relative to the Anchored VWAP right after the anchor event itself — for example, right after an earnings report. If price keeps closing above the Anchored VWAP anchored at the post-earnings open, that's read as buyers holding a persistent edge; closing below it repeatedly is read the opposite way.
The VWAP Fan: Layering Multiple Anchors
A more advanced technique experienced traders use is the VWAP fan. Instead of plotting a single Anchored VWAP, you plot several — each anchored at a different meaningful point (say, the most recent swing low, an earlier swing low, and an earnings date) — all at once.
Overlaying several lines this way produces a fan-shaped spread. Where multiple lines converge tightly into one price zone (a confluence zone), that means the average cost basis of participants who entered at genuinely different points in time happens to coincide — which reads as a more reliable support/resistance zone than any single Anchored VWAP alone. Conversely, when the lines are spread widely apart, it tells you cost bases are scattered across a wide range, and you shouldn't expect a clean reaction in that area.
A Worked Numeric Example
Suppose stock B bottomed at a swing low of $80.00 and has been climbing since. Over the following five trading days, closing price and volume look like this:
| Day | Close | Volume (shares) | Close × Volume |
|---|---|---|---|
| Day 1 (anchor) | $80.00 | 120,000 | $9,600,000 |
| Day 2 | $82.00 | 90,000 | $7,380,000 |
| Day 3 | $84.50 | 150,000 | $12,675,000 |
| Day 4 | $83.00 | 80,000 | $6,640,000 |
| Day 5 | $86.00 | 110,000 | $9,460,000 |
Cumulative volume is 120,000 + 90,000 + 150,000 + 80,000 + 110,000 = 550,000 shares, and cumulative (close × volume) is $45,755,000. So the Anchored VWAP as of day 5 is $45,755,000 ÷ 550,000 ≈ $83.19. If price pulls back from $86.00 to around $83.20 on day 6 without closing below that line, and then bounces, that's read as a confirmation of support near "the average cost basis of everyone who has bought this stock since the day-1 low." That said, this is one supporting data point, not a guarantee — never enter assuming the level will hold without a defined stop.
Limitations and Caveats
- Anchor selection is discretionary. Deciding which swing low to anchor on involves subjective judgment, which means two traders looking at the same chart can draw two different Anchored VWAP lines. That makes this less reproducible than the fully rule-based strategies earlier in this course.
- Thin trading periods can distort it. A single low-volume day doesn't usually dominate the calculation, but if the overall window has thin liquidity throughout, the resulting line is less reliable.
- Support/resistance is never guaranteed. Anchored VWAP identifies a zone participants are statistically more likely to react to — it doesn't guarantee a bounce or a rejection will actually happen there. Always define a separate stop-loss level.
- Too many anchors create clutter, not clarity. When using a VWAP fan, keep it to 3–4 genuinely meaningful anchors — more than that makes confluence zones harder to read, not easier.
- Don't confuse this with the session VWAP reversion strategy. Lesson 10's session VWAP deviation-reversion is a strictly intraday mean-reversion strategy; this lesson's Anchored VWAP is a swing/position-level trend support-resistance confirmation tool. They share a formula but differ in purpose and timeframe.
Summary
- Anchored VWAP is the running sum of (price × volume) divided by cumulative volume, calculated from a trader-chosen starting point rather than the session open.
- It behaves like support or resistance because it approximates the average cost basis of everyone who has held the stock since that anchor point, and that group's behavior (breakeven buying, "same price as everyone else" entries) tends to concentrate around it.
- Anchors work best when they mark a real structural shift — a swing low/high, an earnings date, a major event candle — not an arbitrary date.
- The two standard entry patterns are a pullback bounce off a rising/falling Anchored VWAP during an established trend, and an initial break read right after the anchor event itself.
- A VWAP fan overlays multiple anchors at once; where the lines converge into a confluence zone, that reads as a stronger support/resistance area than any single line alone.
- Account for the discretion involved in anchor selection and the fact that no support/resistance level is guaranteed to hold — use this as a confirming tool alongside a defined stop, not a standalone signal.