Trading Strategies · Lesson 88/88 · 8 min read
AAII Sentiment Survey vs NAAIM Exposure Index: Reading Opinion vs. Position
In this article
Why Not Just Ask People How They Feel?
The Fear & Greed Index (Lesson 87) and the put-call ratio (Lesson 60) both back into sentiment indirectly — they infer how scared the market is from price action, option flow, and bond spreads. Nobody is actually asked how they feel; it's reverse-engineered from behavior. There's an older, simpler alternative: just ask people directly, every week, and publish the raw answers. That's exactly what the AAII Investor Sentiment Survey, run by the American Association of Individual Investors since 1987, and the NAAIM Exposure Index, run by the National Association of Active Investment Managers, have been doing for decades.
The distinction between the two is the whole point of this lesson. AAII asks individual investors what they think will happen over the next six months — an opinion. NAAIM asks professional active managers what percentage of their actual portfolio is currently in stocks — a position. Opinion and position don't always move together, and reading both at once tells you more than either one alone.
AAII: Measuring What Retail Investors Say
Each week, AAII members pick one of three options for where they expect the market to be in six months: Bullish, Neutral, or Bearish. The results are published as percentages of total respondents, and the headline number almost everyone quotes is the Bull-Bear Spread — bullish percentage minus bearish percentage.
- A large positive spread means optimism is dominating the responses.
- A large negative spread means pessimism is dominating.
- The neutral percentage matters too — a high neutral reading is often read as money sitting on the sidelines, undecided rather than committed either way.
The contrarian logic rests on a simple idea: when almost everyone already feels one way, most of the people who were going to act on that feeling already have. If nearly every respondent is bearish, that implies a large share of individual investors have already trimmed positions or raised cash to match that view — leaving comparatively few people left to sell on the next piece of bad news, which is structurally how sharp bounces get started. The mirror case holds at bullish extremes: if almost everyone who wanted upside exposure already bought in, there's less fresh buying power left to extend a rally.
That said, an extreme reading is not a bottom call. In late February 2025, reporting put the AAII Bull-Bear Spread at roughly -41.2%, a level described as historically rare — only a handful of comparable readings since the survey began in 1987. Coverage through May 2025 noted that bearish responses stayed above 50% for 11 straight weeks, an unusually persistent stretch of pessimism. Episodes like these are worth treating as reference cases — "bounces have historically tended to start from zones like this" — rather than as a guaranteed statistic. Specific after-the-fact return numbers tied to any single episode are commentary from the firms reporting them, not a validated, repeatable backtest, so they're best read as anecdotal context, not a rule.
NAAIM: Measuring What Professional Managers Actually Do
The NAAIM Exposure Index surveys member firms every Wednesday and asks a much more concrete question: what percentage of your portfolio is currently exposed to U.S. equities, right now? The answers are averaged into a single weekly number. The key structural difference from AAII is that this isn't an opinion poll — it's a direct report of capital already deployed.
The theoretical range runs from -200% (fully leveraged short) to +200% (2x leveraged long), but historically the index has mostly traded somewhere between roughly 0 and 100.
- Readings above roughly 90 are sometimes flagged as a sign that active managers have already piled aggressively into stocks — a potential crowding signal in some commentary.
- Readings below roughly 40 are generally read as managers having moved defensively into cash or short exposure.
This indicator deserves a more cautious framing than AAII, though. Analysts disagree on how reliable it actually is as a timing tool — one well-known technical-analysis site found no consistent price pattern following high NAAIM readings, and a widely used TradingView script description for the index explicitly states it "is not predictive in nature." In other words, NAAIM is genuinely useful as a window into what professional managers are doing right now, but the evidence for using the number itself as a standalone buy or sell trigger is weak, and that should be stated plainly rather than implied.
AAII vs. NAAIM: Side by Side
| AAII Sentiment Survey | NAAIM Exposure Index | |
|---|---|---|
| Who answers | Individual AAII members | Active fund management firms |
| What's measured | Opinion — 6-month outlook (Bullish/Neutral/Bearish) | Position — actual current equity exposure (%) |
| Scale | 0-100% per category; spread theoretically -100 to +100 | -200% to +200% (historically mostly 0-100) |
| Published | Weekly, Thursdays | Weekly, based on Wednesday data, released Thursdays |
| Running since | 1987 | 2006 |
| Nature | Stated opinion — prone to emotional overstatement | Real capital — reflects what's actually been done |
| View on reliability | Multiple extreme episodes commonly cited as reference points | Mixed — some analysts and even indicator documentation explicitly question its predictive value |
The real takeaway from this table isn't "which one is better" — it's that they're complements, not competitors. When retail opinion and professional positioning lean the same way (both pessimistic, or both aggressively bullish), that's a broader, more convincing extreme than either reading alone. When they diverge, that divergence itself becomes something worth watching — it raises the question of which group moves first.
A Worked Example: Reading Both Together
Imagine a single reporting week with the following numbers.
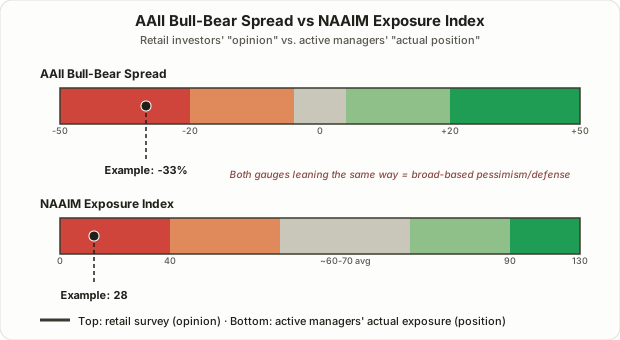
Step 1 — Calculate the AAII spread. Say that week's AAII survey comes in at 22% bullish, 23% neutral, 55% bearish. The Bull-Bear Spread is 22% - 55% = -33%. Against a long-run average that tends to sit somewhere around +5% to +10%, a -33% reading is a clear lean toward pessimism.
Step 2 — Check the NAAIM reading. Say the same week's NAAIM Exposure Index comes in at 28. That means active managers, on average, have only about 28% of their portfolios in equities — well below the index's long-run average, which has historically clustered somewhere in the 60s.
Step 3 — Check for confluence. Retail opinion (-33% on AAII) and professional positioning (28 on NAAIM) are both leaning defensive at the same time. If only one of the two had been pessimistic, it would be reasonable to read that as one narrow group's mood. Both leaning the same way at once suggests a wider slice of market participants has already positioned defensively — which, by the same logic as above, implies relatively fewer remaining sellers.
Step 4 — Don't stop there. This combination is not a green light for a full-size entry on its own. Following the risk-reward discipline from Lesson 6, define a stop before entering, and look for independent confirmation in price itself — a structure shift like the BOS/CHoCH concepts in Lesson 48, or a volume pickup near support — before sizing in, and scale in gradually rather than committing all at once.
Limitations and Traps
- AAII's respondent pool is self-selected. Members who bother to fill out a weekly survey aren't a random cross-section of all individual investors, let alone professional ones. In the social-media era, sentiment swings in this kind of self-reported data can plausibly run hotter than actual market-wide sentiment.
- NAAIM is an average of a limited number of firms. When the respondent pool is small in a given week, one or two firms with an unusually extreme position can swing the headline average more than their actual market footprint would suggest.
- Neither indicator pinpoints timing. The 2022 bear market is the standard counterexample — bearish extremes showed up on the way down, and the market kept falling for months afterward. An extreme reading means "pay closer attention here," not "this is the exact bottom."
- NAAIM's predictive value is genuinely disputed. As noted above, independent analysis has failed to find a consistent price pattern following NAAIM extremes, and even some of the index's own public documentation on trading platforms disclaims predictive power. Treat it as a secondary confirmation tool alongside AAII and price action, not a standalone signal.
- Neither has a direct domestic equivalent. Both surveys poll U.S. participants, so applying them to other markets means leaning on the historical correlation between those markets and U.S. sentiment — a correlation that isn't constant over time.
Frequently Asked Questions
How extreme does the AAII spread need to be before it matters?
There's no single official threshold. A common approach is comparing the current spread to its long-run average and standard deviation, treating readings roughly two standard deviations away from average as historically unusual. Readings below around -30% or above around +30% get flagged as notable extremes in a lot of commentary, but that's a widely used convention, not a hard rule AAII itself has set.
Where can I actually check these numbers each week?
AAII publishes its weekly Sentiment Survey results on its own website, and NAAIM does the same for its Exposure Index — both update on a weekly cycle, typically released on Thursdays.
How is this different from the Fear & Greed Index or the put-call ratio?
The Fear & Greed Index (Lesson 87) and the put-call ratio (Lesson 60) both infer sentiment indirectly from price, volatility, and options data. AAII and NAAIM collect sentiment and positioning directly, by asking. When an indirect, data-derived signal and a direct, survey-based signal point the same way, that agreement is generally a stronger reason to pay attention than either kind of signal alone.
Summary
- The AAII Investor Sentiment Survey asks individual investors directly about their 6-month market outlook and summarizes it as the Bull-Bear Spread — an opinion-based sentiment gauge running since 1987.
- The NAAIM Exposure Index asks professional active managers what share of their portfolio is actually in equities right now — a position-based gauge running since 2006.
- When both lean toward the same extreme at once (retail pessimistic and professionals defensively positioned, or the reverse), that's a broader-based signal worth watching — but it's not a precise top or bottom call.
- NAAIM's predictive reliability is genuinely contested, including in the index's own public documentation, so it's safer used as a secondary confirmation alongside AAII, price structure, and defined risk management than as a standalone trigger.
- Both are direct, survey-based sentiment measures — a different approach from indirect, data-derived indicators like the Fear & Greed Index or the put-call ratio, and combining the two approaches covers more of each other's blind spots.