Trading Strategies · Lesson 55/57 · 9 min read
ADX Indicator Trading Guide: Using DMI to Measure Trend Strength (Not Direction)
In this article
- The Missing Piece: Knowing Whether a Signal Is Even Worth Trusting
- Built From the Same Toolkit as ATR
- How It's Actually Calculated
- Reading ADX Values: A Rough Guide, Not a Law
- Direction Signal: Combining the DI Crossover With an ADX Confirmation
- Rising ADX vs. Falling ADX: The Slope Matters More Than the Level
- Regime Comparison: ADX Above 25 vs. ADX Below 20
- Limitations Worth Knowing
- FAQ
- Summary
The Missing Piece: Knowing Whether a Signal Is Even Worth Trusting
Anyone who has traded the moving average crossover from lesson 1 or the MACD signal-line crossover from lesson 47 eventually runs into the same problem. Those signals look great in a clean trend, but in a sideways, choppy market the same crossovers fire every few days, each one a small loss. The tools tell you which way price crossed — they don't tell you whether the market is even in a state worth trend-trading.
That's the gap the ADX (Average Directional Index) and its companion lines, +DI and -DI (together called the DMI, or Directional Movement Index), were built to fill. ADX doesn't tell you whether price is going up or down. It tells you, on a 0–100 scale, how strongly the market is currently pushing in one direction versus grinding in place. Direction is handled separately by +DI and -DI; ADX only answers "how much conviction is behind that direction right now." Think of it less as an entry signal and more as a filter that answers: given a crossover just fired, is this a regime where I should actually trust it?
Built From the Same Toolkit as ATR
ADX and DMI were introduced by J. Welles Wilder Jr. in his 1978 book New Concepts in Technical Trading Systems — the same book that gave the trading world RSI, Parabolic SAR, and Average True Range (ATR), which we covered in the risk filters lesson. That's not a coincidence: ADX's calculation shares its raw material with ATR, namely the True Range. Where ATR measures how much a stock typically swings, ADX takes that same raw movement data and asks a different question — is that movement lining up in one consistent direction, or is it canceling itself out and going nowhere?
How It's Actually Calculated
The math looks intimidating at first glance, but the underlying logic is simple: separate each day's price action into a directional move and a non-directional move, then normalize and smooth it.
- +DM (directional move up): today's high minus yesterday's high — but only counted if it's larger than the corresponding down-move (yesterday's low minus today's low). Otherwise it's zero.
- -DM (directional move down): yesterday's low minus today's low — counted only if it's larger than the up-move candidate.
- On any given day, only the larger of the two counts. A day where price pushed up and down by similar amounts contributes almost nothing to either +DM or -DM — it's treated as directionless noise.
- Both +DM and -DM are smoothed over 14 periods (the standard default) and divided by the smoothed Average True Range, then multiplied by 100, giving +DI and -DI. Dividing by True Range normalizes the raw price move against the stock's own typical volatility, which is what lets you compare DI readings across stocks trading at very different price levels.
- DX = |+DI − -DI| ÷ (+DI + -DI) × 100. The bigger the gap between the two directional lines, the higher DX climbs.
- ADX is DX smoothed again over 14 periods. Because it's the second layer of 14-period smoothing on top of DI, ADX is the most lagging and least jumpy of the three lines by design.
A Simplified Numeric Walkthrough
Say a stock's 14-period smoothed Average True Range sits at $2.00, with a smoothed +DM of 0.64 and a smoothed -DM of 0.28.
- +DI = 0.64 ÷ 2.00 × 100 = 32
- -DI = 0.28 ÷ 2.00 × 100 = 14
- DX = |32 − 14| ÷ (32 + 14) × 100 = 18 ÷ 46 × 100 ≈ 39
If that DX reading, smoothed over the trailing 14 periods, works out to an ADX of roughly 29, the takeaway is: +DI clearly leads -DI (direction is up), and that lead has held steady enough over the recent stretch to push ADX into what the next section calls "trending" territory. In practice no one computes this by hand — every charting platform plots it automatically — but knowing where the number comes from makes it obvious why it moves the way it does.
Reading ADX Values: A Rough Guide, Not a Law
Because ADX measures pure strength independent of direction, the ranges below are widely cited conventions, not a rigid formula.
| ADX Reading | Common Interpretation |
|---|---|
| 0–20 | No meaningful trend — likely range-bound or choppy |
| 20–25 | A trend may be forming, but not confirmed yet |
| 25–50 | The "sweet spot" where trend-following approaches are generally considered to have an edge |
| 50+ | A very strong trend — though many traders treat this as an overextended zone worth caution rather than a chase signal |
The 25 threshold gets cited constantly, but it traces back to Wilder's own illustrative example more than any universally optimal number — the right cutoff can vary by instrument and timeframe, so treat it as a starting point rather than gospel.
Direction Signal: Combining the DI Crossover With an ADX Confirmation
Put the three lines together and a common trading combination emerges.
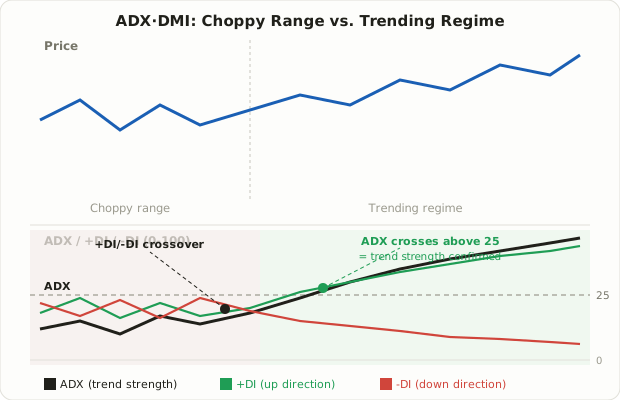
- Long candidate: +DI crosses above -DI while ADX is rising through the 20–25 zone. Direction (the DI cross) and strength (rising ADX) confirm at the same time.
- Short candidate: -DI crosses above +DI, again with ADX rising.
- Ignore the crossover: if ADX is sitting below 20, a DI cross is often treated as low-conviction noise — the directional edge hasn't proven itself yet.
Rising ADX vs. Falling ADX: The Slope Matters More Than the Level
One detail traders often miss: the direction ADX is moving usually carries more information than the raw number itself.
- Rising ADX: whether it's at 20 or 40, a rising ADX means the current trend (whichever way +DI/-DI say it's pointing) is still gaining strength.
- Falling ADX: dropping from 40 to 30 still technically sits in "trending" territory, but it's commonly read as a sign the trend's momentum is fading even though price may still be moving the same direction.
- ADX peaking and rolling over: often flagged as an early warning that a trend is losing steam — but that alone never guarantees a reversal. Strong trends frequently see ADX peak, dip, and climb again multiple times while price keeps grinding the same direction the whole time.
Regime Comparison: ADX Above 25 vs. ADX Below 20
ADX's most practical use isn't as a standalone entry trigger — it's as a filter that decides which of two strategy families covered elsewhere in this course actually fits the current market.
| ADX 25+ (Trending Regime) | ADX Below 20 (Range-Bound Regime) | |
|---|---|---|
| Favored approach | Trend-following tools like the MA crossover, pullback re-entry, or breakout trading | Mean-reversion tools like the ones covered in the mean reversion and four mean-reversion methods lessons |
| Disfavored approach | Fading moves as if price will snap back to a range — tends to produce repeated stop-outs against the trend | Chasing breakouts or crossovers — prone to false breaks and whipsaws |
| Typical price behavior | Pullbacks happen, but highs and lows keep getting extended in one direction | Price oscillates inside a band with no sustained directional edge |
| ADX's role | Confirms "this crossover is worth trusting right now" | Warns "trend signals should probably be discounted here" |
The point of this table isn't that one strategy family is universally better — it's that ADX gives you a fast way to recognize which stage is currently on. The same crossover signal is generally treated with more confidence when ADX is elevated than when it's sitting near the bottom of its range.
Limitations Worth Knowing
- It's a lagging indicator, twice over. Because both the DI lines and ADX itself apply 14-period smoothing, ADX typically crosses its threshold well after a trend has already gotten underway. It's better suited to confirming an existing trend than catching one at the very start.
- Whipsaw around the threshold. When ADX oscillates between roughly 20 and 25, whether the market "counts" as trending can flip back and forth in a way that's more confusing than useful.
- No directional information on its own. ADX by itself says nothing about whether the trend is up or down — it has to be paired with +DI/-DI.
- Strength isn't the same as magnitude. A high ADX doesn't mean price is moving fast — a slow, steady grind higher can produce a high ADX just as easily as a sharp rally. Meanwhile a choppy, high-volatility market with no consistent direction can actually produce a low ADX. Volatility and trend strength are related but distinct concepts.
- The 14-period default isn't fixed. Shorter-term traders sometimes tighten the lookback (to around 7–10 periods) for faster signals; longer-horizon swing traders may widen it.
FAQ
Does ADX above 25 mean I should buy right now?
No. ADX above 25 means the current trend has enough conviction behind it that trend-following signals are generally considered more trustworthy in this regime — it isn't a buy signal by itself. Actual entry direction and timing still need to come from a separate trigger, such as a DI crossover or the pullback method from lesson 9, with ADX acting as the confirmation layer on top.
Should I exit the moment ADX starts falling?
A falling ADX is a useful early warning that a trend's strength is fading, but it isn't a confirmed reversal signal. Strong trends often see ADX dip and recover more than once while price keeps grinding the same direction. Most traders pair ADX with price structure or a separate stop-loss/trailing-stop rule rather than exiting purely because the ADX line turned down.
Can I trade using ADX alone?
That's not generally recommended. ADX is a pure strength gauge with no directional information built in, so at minimum it needs to be read alongside +DI and -DI. In practice, it's treated as one confirmation layer among several — price structure, volume, and a defined entry trigger still do the heavy lifting.
Summary
- ADX measures trend strength on a 0–100 scale, not direction — direction is the job of its companion lines, +DI and -DI.
- It's built from the same True Range data as ATR, keeping only the larger of each day's up-move or down-move as that day's directional contribution before normalizing and smoothing twice.
- A reading around 25 is a widely cited rule of thumb for separating trending from range-bound conditions, but it's a convention traders lean on, not a fixed law.
- Its most practical use isn't as a standalone trigger but as a regime filter — deciding whether this course's trend-following lessons or its mean-reversion lessons are the better fit for current conditions.
- It lags by design, whipsaws near its own threshold, and says nothing about direction on its own, so pairing it with other confirmation is standard practice.