Trading Strategies · Lesson 47/57 · 7 min read
MACD Indicator Trading: Signal Line Crossovers vs. Divergence Signals
In this article
- What MACD Actually Measures
- Why the Math Works: Reading Momentum, Not Just Price
- Signal 1: The Signal Line Crossover
- Signal 2: The Zero-Line Crossover
- Signal Line vs. Zero Line: A Speed-for-Reliability Trade
- Signal 3: Divergence — When Price and Momentum Disagree
- A Worked Numeric Example
- Limitations to Keep in Mind
- MACD vs. Other Momentum Tools
- Summary
What MACD Actually Measures
The moving average crossover strategy treats the moment a short-term MA crosses a long-term MA on the chart as a signal. MACD (Moving Average Convergence Divergence) takes that same idea one step further: instead of just watching two lines cross, it turns the distance between them into its own number, tracking how far apart (diverging) or how close together (converging) the two averages get. Developed by Gerald Appel in the 1970s, it remains one of the most widely taught momentum indicators in trading education today.
MACD has three parts:
- MACD line: the 12-day EMA minus the 26-day EMA
- Signal line: a 9-day EMA of the MACD line itself
- Histogram: the MACD line minus the signal line, plotted as bars
The "12, 26, 9" default isn't a law of physics — it's just Appel's original setting that became the industry convention. Shorter-term traders sometimes tighten it (e.g., 5, 13, 6) for faster signals, while longer-horizon swing traders may widen it. Most traders are advised to master the standard settings before experimenting with custom ones.
Why the Math Works: Reading Momentum, Not Just Price
The 12-day EMA reacts quickly to recent price moves; the 26-day EMA moves more slowly. When an uptrend strengthens, the fast EMA pulls away from the slow EMA faster, so the gap between them (the MACD line) widens — that's "divergence" in the literal sense. When a trend loses steam, the gap narrows — that's "convergence."
In other words, MACD isn't measuring price directly — it's measuring how far short-term momentum has pulled ahead of longer-term momentum. That dual nature is why MACD sits in an odd spot: it's built from moving averages (a trend-following tool) but behaves like a momentum oscillator, overlapping in purpose with something like RSI from the momentum trading lesson even though the math behind each is completely different.
Signal 1: The Signal Line Crossover
The most basic MACD signal is the crossover between the MACD line and its own signal line.
- Bullish crossover: MACD line crosses from below to above the signal line
- Bearish crossover: MACD line crosses from above to below the signal line
Since the histogram is just the MACD line minus the signal line, this crossover happens at the exact moment the histogram crosses zero. In practice, most traders watch the histogram bars flip from positive to negative (or back) as a quick visual cue rather than tracking the two lines separately.
Signal 2: The Zero-Line Crossover
A separate signal comes from watching whether the MACD line itself crosses above or below zero. Since the MACD line equals EMA12 minus EMA26, a positive value means the fast EMA sits above the slow EMA — which is functionally the same information as a moving average golden cross. A move above zero suggests short-term momentum has overtaken the longer-term trend; a move below zero suggests the reverse.
Signal Line vs. Zero Line: A Speed-for-Reliability Trade
Both crossovers aim to catch trend changes, but they behave quite differently in practice.
| Signal Line Crossover | Zero Line Crossover | |
|---|---|---|
| What it compares | MACD line vs. its own 9-day EMA | MACD line vs. zero (EMA12 = EMA26) |
| Signal speed | Relatively fast | Relatively slow, more lagging |
| Signal frequency | High — especially choppy in range-bound markets | Low |
| Main risk | Whipsaws / false signals | Confirms the trend so late that much of the move is already over |
| Character | Closer to a short-term timing trigger | Closer to a broad trend confirmation |
Many traders combine the two rather than picking one: only take a bullish signal-line crossover if the MACD line is already above zero (meaning the broader trend is up), using the zero line as a coarse filter and the signal-line cross as the actual entry trigger. That's the same layered logic used in the trend pullback lesson — confirm the larger trend first, then time the entry off a smaller, faster signal.
Signal 3: Divergence — When Price and Momentum Disagree
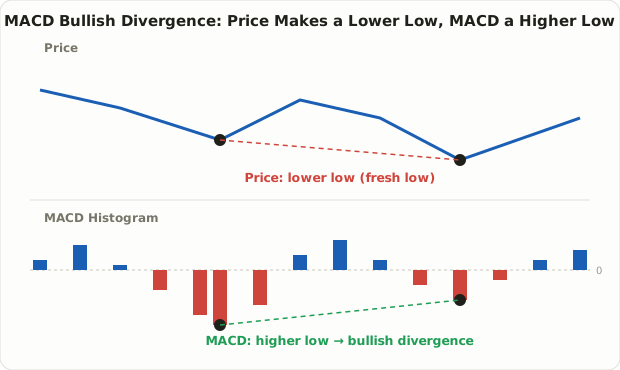
Divergence is the reason MACD is used well beyond simple crossovers. It occurs when the direction of price's highs/lows disagrees with the direction of MACD's (or the histogram's) highs/lows.
- Regular bullish divergence: price makes a lower low (looks bearish), but MACD makes a higher low. Price is still falling, but the momentum underneath it isn't getting weaker — commonly read as an early warning that downside pressure is fading.
- Regular bearish divergence: price makes a higher high, but MACD makes a lower high. Price hit a fresh high, but the buying force behind it has already started to weaken.
There's also hidden divergence, which points the opposite way. Hidden bullish divergence happens when price makes a higher low (a shallow pullback inside an uptrend) while MACD makes a lower low — typically read not as a reversal warning, but as a sign that the existing uptrend is likely to continue. The practical distinction: regular divergence warns "the trend may be turning," while hidden divergence suggests "this is just a pullback, the trend holds."
⚠️ Divergence never guarantees a reversal, or a specific timeline for one. In strong trends, divergence can appear and disappear repeatedly while price keeps grinding in the same direction. It's widely treated as a warning flag rather than a standalone trigger — most traders pair it with a separate confirmation, such as a trendline break or a reversal candle, before actually entering a trade.
A Worked Numeric Example
Suppose a stock's EMA12 sits at $52.00 and its EMA26 at $50.00. The MACD line is 52.00 − 50.00 = 2.00. If the 9-day EMA of that MACD line (the signal line) is 1.70, the histogram reads 2.00 − 1.70 = +0.30, a positive value indicating upward momentum currently has the edge.
The next day, suppose the gap between EMA12 and EMA26 narrows to 1.80, while the signal line is still at 1.90. The histogram now reads 1.80 − 1.90 = −0.10 — negative, meaning a bearish crossover just occurred. Because these values are denominated in price units, their absolute size varies enormously between a $5 stock and a $500 stock — which is why traders generally track whether a crossover happened, whether the histogram bars are expanding or shrinking, and whether divergence is present, rather than the raw MACD number itself.
Limitations to Keep in Mind
- It's fundamentally a lagging indicator. Built from EMAs, MACD signals arrive after the underlying trend shift has already begun, just like any moving-average-based tool.
- Whipsaws in sideways markets. Choppy, directionless price action can trigger repeated signal-line crossovers in quick succession, each one a small loss if traded mechanically.
- Absolute values aren't comparable across stocks. A MACD reading of "5" on one stock and "0.05" on another tells you nothing about which trend is stronger — only relative change within the same stock's own history is meaningful.
- Divergence is somewhat subjective. Which swing high or low you choose as your comparison point can make divergence look present or absent, so different traders can reasonably disagree on the same chart.
MACD vs. Other Momentum Tools
MACD, RSI, and a plain moving average crossover all overlap in purpose but differ in what they actually measure.
| MACD | RSI | MA Crossover | |
|---|---|---|---|
| Built from | The gap between two EMAs | Ratio of average gains to average losses | Position of a single moving average |
| Value range | Unbounded (price units) | Fixed 0–100 | Unbounded (price itself) |
| Signature signal | Signal-line crossover, divergence | Overbought (70+) / oversold (30-) | Golden cross / death cross |
| Relative strength | Reasonably fast at flagging momentum shifts | Good at spotting extreme overheated/oversold zones | Simple, intuitive to interpret |
All three are different ways of processing the same underlying ingredient — moving averages of price. In practice, it's common to layer them: use MACD to catch an early momentum shift, then check RSI to see whether the stock is also overbought or oversold before acting.
Summary
- MACD combines the gap between EMA12 and EMA26 (the MACD line), a 9-day EMA of that gap (the signal line), and the difference between the two (the histogram) into a single momentum readout.
- Signal-line crossovers are fast but whipsaw-prone; zero-line crossovers are slower but confirm the broader trend — combining the two (zero line as filter, signal line as trigger) is a common approach.
- Divergence occurs when price and MACD disagree in direction: regular divergence warns of a possible reversal, while hidden divergence suggests the existing trend is likely to continue.
- Divergence never guarantees a reversal and MACD remains a lagging indicator, so pairing it with an independent confirmation signal is standard practice rather than optional.