Trading Strategies · Lesson 16/57 · 7 min read
Order Flow Trading: Reading Footprint Charts and Cumulative Volume Delta (CVD)
In this article
- There's More Inside a Candle Than Five Numbers
- Footprint Charts: Splitting One Candle by Price Level
- Delta and Cumulative Volume Delta (CVD): Aggression as a Single Number
- Delta Divergence: Price Climbs, But the Fuel Runs Out
- Stacked Imbalances: Absorption or a Launchpad for a Breakout
- A Worked Numeric Example
- How It Differs From Volume Profile
- Limitations and Caveats
- Summary
There's More Inside a Candle Than Five Numbers
Every indicator this course has covered so far — moving averages, RSI, Bollinger Bands, Volume Profile — works off a candle's finished summary: open, high, low, close, and total volume. But a lot happens in the seconds or minutes it takes to build that one candle. Volume traded at the exact same price can mean two very different things depending on who initiated it: did a buyer aggressively hit the ask to get filled, or did a seller aggressively hit the bid? That distinction is invisible in an ordinary candle. Footprint charts expose it directly, and the broader trading approach built around reading it is usually called order flow trading.
This lesson sits next to Lesson 12's Volume Profile but answers a genuinely different question. Volume Profile asks where trading has piled up over a stretch of time — it's cumulative, positional information. Order flow asks which side was the aggressor in any given trade — it's directional, moment-to-moment information. The two complement each other well, but this lesson focuses on what's unique to order flow.
Footprint Charts: Splitting One Candle by Price Level
A regular candle compresses everything into five numbers. A footprint chart un-compresses it: for every price tick the candle traded through, it shows sell-initiated volume and buy-initiated volume separately. "Sell-initiated" means a trader hit the bid — sold immediately into standing buy orders. "Buy-initiated" means a trader hit the ask — bought immediately into standing sell orders. Passive limit orders sitting quietly in the book don't count here; only orders that actively crossed the spread to get filled do.
Stack these "sell x | buy y" pairs vertically across every price level a candle touched, and you get a clear picture of where the aggression concentrated while that candle was forming. A candle that closes green can still show heavy sell-side aggression at its upper price levels — meaning the apparent strength was fighting real resistance the whole way up, something the OHLC summary alone would never reveal.
Delta and Cumulative Volume Delta (CVD): Aggression as a Single Number
Reading raw footprint data tick by tick isn't practical in real time, so traders typically boil it down to two derived numbers.
- Delta: (buy-initiated volume − sell-initiated volume) for a single candle. Positive means buyers were the more aggressive side; negative means sellers were.
- Cumulative Volume Delta (CVD): a running sum of delta over time, usually plotted as its own line beneath the price chart so it can be compared side by side with price action.
CVD's job is simple: it tells you whether a price move is actually backed by real aggression. In a healthy uptrend, price making a new high and CVD making a new high (or something close to it) tend to move together — buyers are genuinely still crossing the spread to push price higher.
Delta Divergence: Price Climbs, But the Fuel Runs Out
The signal traders watch for is when price and CVD stop agreeing — this is called delta divergence.
- Bearish divergence: price prints a higher high than its previous swing, but CVD prints a lower high than its own previous swing. Price went up, but the buying pressure behind it actually weakened. This is often read as a sign that a small number of large orders (or short covering) pushed price up while broad buy-side participation was quietly fading.
- Bullish divergence: price prints a lower low, but CVD prints a higher low — sell-side aggression is losing steam even as price keeps dropping, which is often read as a sign the decline is running out of fuel.
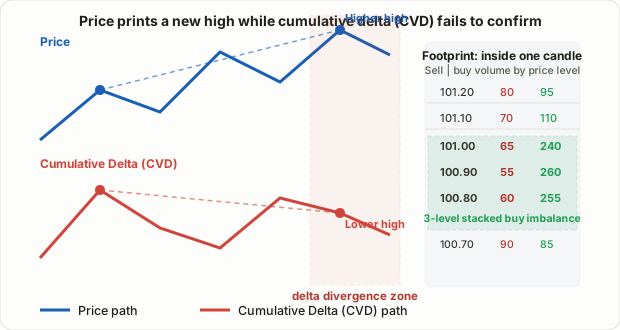
⚠️ A divergence appearing doesn't guarantee an immediate reversal. In practice, many traders wait for a secondary confirmation — a break of a nearby support/resistance level, or a retest — before acting on the divergence alone.
Stacked Imbalances: Absorption or a Launchpad for a Breakout
Another signal footprint traders lean on is the stacked imbalance. At any single price level, if buy-initiated volume heavily outweighs sell-initiated volume (or vice versa), that level shows an "imbalance." When that same-direction imbalance repeats across three or more consecutive price levels, it's called a stacked imbalance.
A commonly cited threshold is one side outnumbering the other by 3x (300%) or more across at least three consecutive levels. That ratio and level count are widely used conventions, not a fixed industry standard — different platforms and traders tune them differently.
A stacked imbalance can resolve two ways:
- Absorption: price fails to break through that zone and instead reverses. A large resting order on the other side (say, an institutional sell wall sitting as limit orders) absorbed all that aggressive buying and held the level. This reads as a reversal signal.
- Breakout setup: price pushes straight through the zone. Aggressive buying overwhelmed whatever resistance was there, which reads as a sign the move is likely to continue or accelerate.
The key point: you can't tell which outcome you're looking at until you see how price actually reacts on the next candle or two. The imbalance itself only tells you something significant is happening at that level — not which direction it resolves.
A Worked Numeric Example
Suppose a 5-minute candle on stock A opens at $100.70 and closes at $101.20.
| Price level | Sell volume | Buy volume | Ratio |
|---|---|---|---|
| 101.20 | 80 | 95 | 1.2x |
| 101.10 | 70 | 110 | 1.6x |
| 101.00 | 65 | 240 | 3.7x |
| 100.90 | 55 | 260 | 4.7x |
| 100.80 | 60 | 255 | 4.3x |
| 100.70 | 90 | 85 | 0.9x |
Buy volume outnumbers sell volume by more than 3x across three consecutive levels (100.80–101.00) — a textbook stacked imbalance. This candle's delta comes out to (95+110+240+260+255+85) − (80+70+65+55+60+90) = 1045 − 420 = +625, strongly positive. If the prior up-candle had an even larger delta while price makes a new high on this one, that's an early sign of the bearish delta divergence described above. Conversely, if the next candle keeps pushing above 101.00 without price sliding back below it, that leans toward reading the 100.80–101.00 stack as a breakout launchpad rather than absorption.
How It Differs From Volume Profile
Order flow and Volume Profile get mentioned in the same breath a lot, but they answer different questions.
| Volume Profile | Order Flow (footprint/CVD) | |
|---|---|---|
| Core question | Where has volume piled up? | Which side initiated the trade — buyer or seller? |
| Time frame | Accumulated across many candles (e.g., the last 120 bars) | Inside a single candle, near real time |
| Data required | Bar-level OHLCV | Tick-level trade data with aggressor side |
| Signature signals | POC, VAH/VAL reversion | Delta divergence, stacked imbalance, absorption |
Used together, Volume Profile supplies the structural reason a level might matter ("why here"), and order flow supplies the real-time confirmation of who's actually winning the fight at that level ("who's in control right now").
Limitations and Caveats
- Requires tick-level trade data. Footprint and delta calculations need trade data tagged with the aggressor side, which ordinary close/volume feeds don't provide. This usually means a dedicated platform or a paid data subscription.
- "Buy-initiated vs. sell-initiated" classification can vary by provider. How a trade printed exactly at the midpoint between bid and ask gets classified differs across data vendors, so the same candle can show a different delta depending on the source.
- Low-liquidity names distort the signal easily. When trades are sparse, a single large order can swing delta to an extreme, making stacked imbalances and divergences far less reliable.
- Well-known patterns invite counter-play. Because stacked imbalances are a widely recognized pattern, other participants sometimes trade directly against them, which can make the pattern fail to resolve as expected. Most traders treat it as one confirming input alongside support/resistance, trend, and volume structure rather than a standalone signal.
- Reading it well takes practice. Both divergence and imbalance are matters of degree, not a clean on/off switch, so this style of trading tends to involve more discretionary judgment than the rule-based strategies covered earlier in this course.
Summary
- Order flow trading looks at who was more aggressive — buyers or sellers — while a candle is forming, rather than only its finished OHLCV summary.
- Footprint charts break a single candle into sell/buy volume by price level; delta (buy minus sell) and its running total, CVD, summarize that data into something usable in real time.
- Delta divergence — price and CVD disagreeing on whether a new high or low is genuine — signals that the aggression backing the current move is weakening.
- A stacked imbalance (one side dominating across consecutive price levels) can resolve as absorption (reversal) or a breakout launchpad (continuation); only the next candle's reaction tells you which.
- Volume Profile answers "where," order flow answers "who's winning right now," and the two work well as complements.
- Account for the need for tick data, provider-to-provider classification differences, and distortion in illiquid names — and treat this as a confirming layer alongside other techniques, not a standalone edge.