Trading Strategies · Lesson 19/57 · 11 min read
Ichimoku Cloud Trading Strategy: Reading Trend Direction With Kumo Breakouts and TK Crosses
In this article
Five Lines That Show Market Balance "At a Glance"
The Ichimoku Cloud (Ichimoku Kinko Hyo, literally "one-glance equilibrium chart") was developed over several decades by Japanese journalist Goichi Hosoda, writing under the pen name "Ichimoku Sanjin," and first published in the 1930s–1960s. The name describes exactly what it's meant to do: let a trader gauge the overall balance of the market with a single look at the chart. It remains a staple in retail trading education content and YouTube technical-analysis channels today, particularly among swing and position traders.
Most indicators covered earlier in this course look at one thing at a time — a single moving average, a single oscillator like RSI or CMF. Ichimoku is structurally different: it plots five lines simultaneously to show trend direction, trend strength, current support/resistance, and even a projected support/resistance zone 26 periods into the future — all on one chart.
What the Five Lines Actually Calculate
Ichimoku traditionally uses three periods: 9, 26, and 52. These numbers trace back to old Japanese trading-week conventions (roughly 1.5 weeks, one month, and two months under a six-day trading week) — they're a convention, not a rule derived from any universal market law, so treat them as sensible defaults rather than fixed constants.
| Line | Formula | What It Represents |
|---|---|---|
| Tenkan-sen (Conversion Line) | (9-period high + 9-period low) ÷ 2 | Short-term equilibrium price, reacts faster than a moving average |
| Kijun-sen (Base Line) | (26-period high + 26-period low) ÷ 2 | Medium-term equilibrium price, often treated as the trend's pivot |
| Senkou Span A (Leading Span A) | (Tenkan-sen + Kijun-sen) ÷ 2, plotted 26 periods forward | One boundary of the cloud |
| Senkou Span B (Leading Span B) | (52-period high + 52-period low) ÷ 2, plotted 26 periods forward | The other boundary of the cloud |
| Chikou Span (Lagging Span) | Today's close, plotted 26 periods back | A confirmation line comparing today's price to price 26 periods ago |
Tenkan-sen and Kijun-sen look like moving averages, but the math is different: a simple moving average is the average of N days of closing prices, while Tenkan-sen and Kijun-sen are the midpoint of the N-period high and low. That makes them more sensitive to recent extremes than a standard moving average — and because Kijun-sen only moves when a new 26-period high or low replaces an old one, it frequently goes flat for extended stretches. A flat Kijun-sen is often read as a level the market currently treats as fair value, and price pulling back to it is sometimes described as reverting to that equilibrium "magnet" — a widely cited rule of thumb among Ichimoku traders, not a statistically validated law that holds for every ticker.
The space between Senkou Span A and Senkou Span B is called the Kumo (cloud) — the feature that makes Ichimoku instantly recognizable. Because both lines are plotted 26 periods into the future, the cloud shows not just where price has already reacted, but a projected support/resistance zone for a point in time that hasn't happened yet. By convention, the cloud is shaded one color when Span A sits above Span B (a bullish kumo) and the opposite color when Span B is above Span A (a bearish kumo), so the shading alone tells you the projected bias at a glance.
Why It Works: A Visual Consensus Across Multiple Timeframes
Ichimoku earns its continued use not because any single line is magic, but because it overlays equilibrium prices computed on three separate timeframes — short (9), medium (26), and long (52) — on the same chart.
- When Tenkan-sen sits above Kijun-sen, both sit above the cloud, and the Chikou Span sits above the price from 26 periods ago, all three timeframes are agreeing on the same direction at once. That kind of layered, independent confirmation is Ichimoku's central logic: the more of these conditions line up simultaneously, the more weight the trend carries.
- When price is trapped inside the cloud and Tenkan-sen and Kijun-sen are tangled together, that's read as a market in equilibrium with no clear direction — a range. Lesson 14's TTM Squeeze identifies the same kind of stall through contracting volatility bands; Ichimoku identifies it through the convergence of multi-timeframe equilibrium prices instead — a different lens on a similar underlying condition.
- The cloud projected 26 periods forward functions as a leading indicator: based on data available today, it flags where a support or resistance zone is likely to sit at a future point in time. That's something a plain moving average or a static support/resistance line simply can't offer.
Four Signals Used in Practice
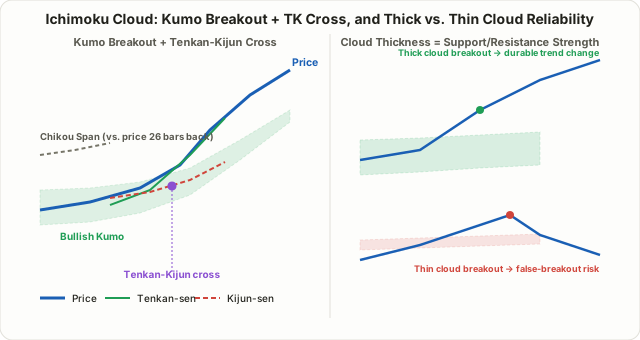
1. Kumo Breakout — When price closes decisively above or below the cloud, that's treated as Ichimoku's strongest trend-change signal. A breakout through a thick section of cloud required more buying or selling pressure to happen, so it's read as more durable; a breakout through a thin section is easier to achieve and correspondingly more prone to snapping back (a false breakout). Cloud thickness itself functions as a visual measure of how strong the support/resistance in that zone actually is.
2. Tenkan-Kijun Cross (TK Cross) — Tenkan-sen crossing above Kijun-sen is read similarly to a golden cross; crossing below is read as bearish. Unlike the plain moving-average cross covered in Lesson 1, common practice with Ichimoku is to filter this cross by where it happens relative to the cloud. A bullish TK cross above the cloud is typically treated as a pullback re-entry signal within an established uptrend, while the same cross happening below or inside the cloud is treated as lower-conviction.
3. Kumo Twist — The point where Senkou Span A and Senkou Span B swap positions in the projected future cloud is called a Kumo twist. Because this is calculated up to 26 periods ahead of the current bar, it functions as an early warning that equilibrium may break down around that future date. A twist by itself is not an entry signal — it's better read as "watch this zone closely for a possible trend change," not a trade trigger.
4. Chikou Span Confirmation — The Chikou Span, today's close plotted 26 periods into the past, confirms an uptrend when it sits above both the price and the cloud from 26 periods ago, and confirms a downtrend when it sits below. Many traders treat this as a tie-breaker: even if the other three signals point bullish, a Chikou Span still trapped below price from 26 periods back is read as an incomplete confirmation. The signal carries extra weight when that 26-period-old zone happens to coincide with an old resistance level or a thick cloud — the Chikou Span breaking through that zone functions as an independent breakout confirmation of its own.
Combining all four into a checklist makes the read much clearer in practice:
| Check | Bullish Reading |
|---|---|
| Price vs. cloud | Price closing above the cloud |
| Future cloud color (26 periods out) | Senkou Span A > Senkou Span B (bullish kumo) |
| Tenkan-Kijun | Tenkan above Kijun, ideally crossing above the cloud |
| Chikou Span | Above price and cloud from 26 periods ago |
When all four line up, three timeframes and two independent confirmation tools are pointing the same direction at once — stronger evidence than any single-indicator signal alone. When only two or three line up and the rest are mixed, that's better read as a transitional state where sizing down or waiting is the safer call.
A Worked Numeric Example
Suppose stock C's recent high/low data looks like this:
- Last 9 trading days: high $54.00 / low $48.00
- Last 26 trading days: high $58.00 / low $42.00
- Last 52 trading days: high $61.00 / low $39.00
Today's Tenkan-sen and Kijun-sen:
Tenkan-sen = (54.00 + 48.00) ÷ 2 = $51.00
Kijun-sen = (58.00 + 42.00) ÷ 2 = $50.00
Tenkan-sen ($51.00) sits above Kijun-sen ($50.00) — the short-term equilibrium is running above the medium-term one, a bullish tilt. The cloud boundary values that will be plotted 26 periods from today:
Senkou Span A (plotted +26) = (Tenkan + Kijun) ÷ 2 = (51.00 + 50.00) ÷ 2 = $50.50
Senkou Span B (plotted +26) = (52-day high + low) ÷ 2 = (61.00 + 39.00) ÷ 2 = $50.00
Since Senkou Span A ($50.50) sits above Senkou Span B ($50.00), the cloud forming 26 periods from now will be bullish (a green/upward kumo), projecting a future support zone between roughly $50.00 and $50.50. If today's close is $52.50 and that's above the price from 26 periods ago (say $49.80), the Chikou Span confirms the uptrend too. With Tenkan above Kijun, a confirmed Chikou Span, and a bullish projected cloud all agreeing, this is a case where three separate angles converge on the same bullish read — though it's worth repeating that all three lining up like this is the clean textbook case, not the typical one.
If this were a live entry, Lesson 6's Risk-Reward and Money Management framework still applies — Ichimoku doesn't replace a defined stop. A common convention is placing the stop just beyond the far edge of the cloud: here, below Senkou Span B at roughly $50.00. With entry at $52.50 and a stop near $50.00, risk is about $2.50 per share; targeting the prior swing high near $58.00 gives roughly $5.50 of reward, for a risk-reward of about 2.2:1. That ratio belongs to this one hypothetical example — it isn't a general performance statistic for Ichimoku setups.
The bearish mirror image works the same way: if Tenkan-sen sits below Kijun-sen, price closes under the cloud, and the Chikou Span sits below price from 26 periods back, all three signals agree on a downtrend. A short entry would look for a bounce that stalls at the underside of the cloud (now acting as resistance), with the stop placed above the cloud's far edge — the exact same logic, mirrored.
How This Differs From Earlier Lessons
| Lesson 1: MA Crossover | Lesson 17: Anchored VWAP | Ichimoku Cloud | |
|---|---|---|---|
| Reference price | Average of closes | Volume-weighted average | Midpoint of high/low |
| Timeframes combined | Two lines, one comparison | One anchor point | Three timeframes (9/26/52) at once |
| Future projection | None | None | Cloud projected 26 periods forward |
| Support/resistance strength | Binary (crossed or not) | A single line | Cloud thickness conveys strength directly |
The real differentiator isn't any one formula — it's that Ichimoku packages several independent confirmation tools into a single chart by design.
Limitations and Caveats
- Signals get noisy in range-bound markets. With no clear trend, price whipsaws in and out of the cloud and Tenkan/Kijun cross back and forth repeatedly, producing frequent false signals and repeated stop-outs. Ichimoku works best in trending conditions — checking how often price has crossed the cloud recently is a quick way to gauge whether you're in a trend or a range before trusting a signal.
- It's structurally lagging. Because Kijun-sen and the cloud are built on 26-period high/low ranges (and the cloud is further displaced forward), they react slowly to sudden direction changes. Ichimoku suits swing and position trading better than fast scalping, and tends to be treated as more reliable on daily or 4-hour charts than on 1- or 5-minute charts.
- The standard 9-26-52 periods aren't universally optimal. These numbers came from an old Japanese trading-week convention, not a value validated across every market and timeframe. Some traders adjust the periods for a modern five-day trading week, but that's a discretionary deviation from the standard — worth knowing you're making before you make it, since it also means your chart no longer aligns with what most other Ichimoku traders are watching.
- The chart can look cluttered. Five lines rendering simultaneously is visually dense for a newcomer. It's reasonable to start with just the cloud and Tenkan/Kijun, then add the Chikou Span once the basics feel familiar.
- It works better as a filter than a standalone signal. Similar to Lesson 13's ATR/CMF Risk Filters, Ichimoku tends to add the most value when used to confirm that another strategy's entry aligns with the broader trend — for example, checking whether price sits above the cloud before acting on a Lesson 2 momentum signal or a Lesson 9 pullback re-entry — rather than generating entries entirely on its own.
Summary
- Ichimoku Cloud is built from five lines — Tenkan-sen, Kijun-sen, Senkou Span A, Senkou Span B, and the Chikou Span — using standard periods of 9, 26, and 52.
- Tenkan-sen and Kijun-sen are midpoints of high/low ranges, not averages of closes, which makes them more reactive to recent extremes than a plain moving average.
- The Kumo (cloud), the space between Senkou Span A and B, is projected 26 periods into the future, offering a leading view of support/resistance rather than just a trailing one.
- The four core signals are the Kumo breakout, a cloud-filtered Tenkan-Kijun cross, the Kumo twist, and Chikou Span confirmation — conviction rises when multiple signals agree at once.
- It performs best in trending markets, lags structurally due to its high/low-and-displacement construction, and rests on period conventions that aren't a universal law — treat it as one confirmation layer within a broader risk-managed system, not a standalone trading system on its own.