Trading Strategies · Lesson 20/57 · 8 min read
Stan Weinstein's Stage Analysis: Timing Buys and Sells With the 30-Week Moving Average
In this article
Why Stage Analysis Still Matters
Stan Weinstein codified a simple but powerful observation in his 1988 book Secrets for Profiting in Bull and Bear Markets: stocks cycle through four recurring stages over time. Decades later, the framework is still referenced constantly, and the reason is simple — it isn't a prediction tool, it's a structure-reading tool. Instead of trying to guess whether a stock will go up or down next, Stage Analysis asks a narrower question: which of the four stages is this stock in right now? Answering that alone draws a much clearer line between "this is buyable" and "do not touch this."
The moving-average tools covered earlier in this course — Lesson 1's golden cross, Lesson 9's pullback re-entry — mostly use daily charts and short-period averages to time entries over days or weeks. Stage Analysis operates on an entirely different layer: using weekly charts and a single 30-week moving average, it identifies which multi-month-to-multi-year phase of a broader cycle a stock is currently in. It's a position-trading and long-term-investing framework, not a scalping tool. When an index is grinding to new all-time highs, telling "still buyable" apart from "already running out of room" gets harder — and that distinction is exactly what Stage Analysis was built to make.
The Four Stages and How to Identify Them
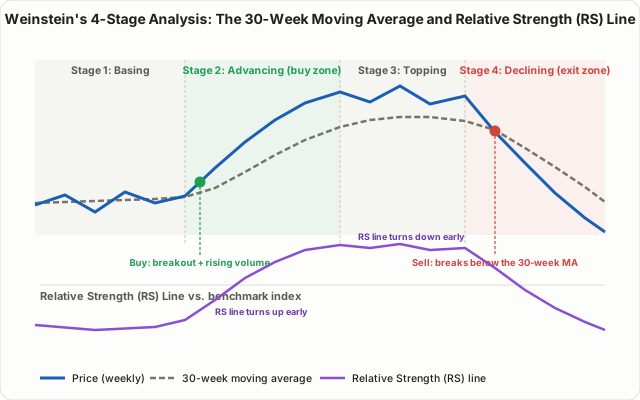
Stage Analysis reads the relationship between the weekly close, a 30-week simple moving average (roughly equivalent to a 150-day line on daily charts), and volume behavior around key turning points.
| Stage | Name | Price vs. 30-week MA | 30-week MA slope | Characteristics |
|---|---|---|---|---|
| 1 | Basing | Whipsaws back and forth across the MA | Flat | Selling pressure exhausted after a prior decline; low volume, sideways action |
| 2 | Advancing | Holds consistently above the MA | Turns upward | Volume spikes on resistance breakout; pullbacks find support at the MA |
| 3 | Topping | Whipsaws around the MA again, near highs | Starts to flatten | Fails to make convincing new highs; volatility widens as late distribution occurs |
| 4 | Declining | Holds consistently below the MA | Turns downward | Rallies come on weak volume; the MA flips from support to resistance |
The four stages repeat in this order — Stage 1 (base) → Stage 2 (advance) → Stage 3 (top) → Stage 4 (decline) → back to Stage 1. Weinstein's central rule is blunt: buy only during Stage 2, and ideally as early into Stage 2 as possible. Buy during Stage 1 and capital sits idle for an unknown number of weeks or months waiting for a breakout that might not come. Buy during Stage 3 or 4 and you're effectively taking the other side of a trade that smart money is already exiting.
Why It Works: The 30-Week MA Is Reliable Because It's Slow
The method's core strength is, somewhat counterintuitively, how sluggish the 30-week MA is. A short average like a 5- or 20-day line can flip direction on a day or two of noise. A 30-week (roughly 210 trading day) average barely reacts to a single week's headline or gap. So when the slope of the 30-week MA actually changes, that's rarely noise — it's more likely evidence of a real, months-long shift in accumulated buying or selling pressure.
Volume behaves the same way for the same reason. During a Stage 1 base, trading tends to thin out as exhausted sellers and cautious buyers both sit on the sidelines; when Stage 2 begins, volume often expands noticeably on the breakout. That's commonly read as capital that had been waiting on the sidelines starting to commit at once — consistent with the broader market-microstructure observation that price often moves first on the actions of a smaller number of informed participants, with volume confirming as a wider group follows. The mirror image applies heading into Stage 4: rallies that come without volume support are read as a sign that buyers are no longer adding real conviction behind the bounce.
The Relative Strength (RS) Line: A Second Axis
Alongside price and volume, Stage Analysis leans heavily on the Relative Strength Line (RS Line) — a plot of a stock's price divided by a benchmark index. Despite the similar name, this has nothing to do with the RSI oscillator covered in Lesson 2; the calculation is entirely different.
RS Line value = Stock closing price ÷ Benchmark index closing price
A rising RS Line means the stock is outperforming the broader index — climbing faster in an uptrend, or falling less in a downtrend. One of Weinstein's most cited observations is that the RS Line frequently changes direction before price does. A stock still stuck in a Stage 1 base whose RS Line is already pushing to new highs is often read as an early sign that money is rotating into that name ahead of the broader market. Conversely, if price is still making new highs but the RS Line has already started rolling over, that's treated as an early warning that a Stage 3 top may be forming. This is worth flagging clearly: it's a rule of thumb from Weinstein's own observations and widely repeated by practitioners since, not a statistically validated leading indicator that holds across every stock and every cycle.
A Worked Numeric Example
Suppose stock E has spent the last eight months chopping between $40.00 and $52.00, repeatedly crossing its 30-week MA (sitting around $46.00) on declining volume. That's a textbook Stage 1 base.
In a subsequent week, stock E breaks above the $52.00 range high and closes at $54.50, on volume 2.3 times the trailing 10-week average. Over the same stretch, the 30-week MA has edged from $46.00 to $46.50 — a modest but real turn upward. And for the 2-3 weeks leading into that breakout, the RS Line had already been printing 6-month highs. Three conditions line up at once — (1) resistance breakout with a volume surge, (2) the 30-week MA's slope turning up, and (3) the RS Line leading to the upside — making this a textbook Stage 2 entry signal.
Entering here would still follow Lesson 6's Risk-Reward and Money Management framework — a defined stop is not optional. A common Stage Analysis stop is placed at whichever is closer: the low of the prior Stage 1 base, or a meaningful close back below the 30-week MA. Rather than using the full range low near $40.00, placing the stop near a tighter recent swing low around $50.00 puts risk at roughly $4.50 per share; targeting a move equal to the prior base's $12.00 range gives roughly $12.00 of reward, for a risk-reward near 2.7:1. That ratio belongs to this one hypothetical example — it isn't a general performance statistic for Stage Analysis.
How This Differs From Earlier Lessons
| Lesson 1: MA Crossover | Lesson 9: MA Pullback Re-Entry | Stage Analysis | |
|---|---|---|---|
| Chart timeframe | Usually daily | Daily | Weekly |
| Moving average | Two lines compared | EMA(9)/EMA(21) | Single 30-week line |
| Trading style | Swing to medium-term | Day trade to swing | Position to long-term |
| Secondary confirmation | Whether a cross occurred | Trend alignment | Relative strength (RS) line |
| What it decides | Entry timing | Re-entry timing | Which stocks to hold, and which stage they're in |
The differentiator isn't a sharper entry-timing tool — it's a filter for stock selection and holding-versus-exiting decisions at the stage level. In practice, traders often use Stage Analysis to first narrow a universe down to Stage 2 candidates, then apply a finer-grained timing tool — Lesson 2's momentum approach or Lesson 9's pullback re-entry — to pick the actual entry within that shortlist.
Limitations and Caveats
- It's structurally lagging. Because it relies on a 30-week average, confirmation that a stage has actually changed often arrives weeks after the transition began. This isn't a tool for catching the exact first week of a base or the exact last week of a top — it's built to catch a move that's already partly underway without missing the bulk of it.
- False Stage 2 breakouts happen. A stock can break above resistance and slip back into its range shortly after — a "failed Stage 2." A breakout that doesn't come with both a volume surge and a leading RS Line should be treated as lower-conviction.
- Thinly traded stocks distort the read. Low-volume names can show wild weekly candles and volume spikes from just a handful of trades, which undermines the reliability of stage identification. Weinstein himself recommended favoring names with adequate liquidity for this reason.
- It needs to be read alongside the broader market's own stage. When the benchmark index itself is in Stage 3 or 4, an individual stock that looks like Stage 2 often gets dragged down anyway before long. Checking the stage of the index itself, not just the individual name, is closer to how the method is meant to be applied.
- It doesn't fit scalping or day trading. Being weekly-chart-based, it has no use for day-to-day timing precision — it's best treated as a framework for positions held over weeks to months, not hours.
Summary
- Stan Weinstein's Stage Analysis holds that stocks cycle through four repeating stages — Stage 1 (basing), Stage 2 (advancing), Stage 3 (topping), and Stage 4 (declining) — and restricts buying to Stage 2, ideally early in it.
- The core tools for identifying which stage a stock is in are the position and slope of the 30-week moving average relative to weekly closes, plus volume behavior around breakouts and breakdowns.
- The Relative Strength (RS) Line (stock price ÷ index price) is often observed to turn before price does, functioning as an early signal for Stage 2 entries and an early warning for Stage 3 tops.
- The slow-moving 30-week MA resists short-term noise, but that same slowness makes the method structurally lagging, and it grows less reliable on thinly traded names.
- It works best as a filter for stock selection and stage identification rather than a precise entry-timing tool — pairing it with this course's other momentum or pullback strategies for the actual entry tends to be more reliable in practice.