Trading Strategies · Lesson 34/57 · 10 min read
Elliott Wave Theory Trading: Reading Trend Position with 5-Wave Impulses and 3-Wave Corrections
In this article
- What Elliott Wave Theory Actually Claims
- The Five Impulse Waves and the Psychology Behind Each
- The Three-Wave Correction: A-B-C
- The Three Inviolable Rules
- A Practical Entry Approach: Buying the End of Wave 2 for Wave 3
- Fractals: Waves Inside Waves
- Elliott Wave vs. Fibonacci Retracement: Different Tools, Different Jobs
- Common Mistakes and Limitations
- FAQ
- Summary
What Elliott Wave Theory Actually Claims
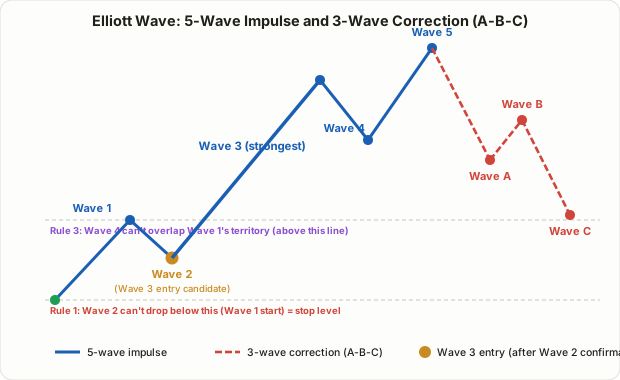
Elliott Wave Theory comes from Ralph Nelson Elliott, an accountant who spent the 1930s poring over decades of stock price charts and concluded that prices don't move randomly — they move in a repeating pattern shaped by the swing between crowd optimism and crowd pessimism. The core structure is simple to state: a trend unfolds in five waves moving with the trend (an impulse), followed by three waves that correct it, for eight waves total in one complete cycle.
The reason this framework keeps getting rediscovered by each new generation of traders isn't that it beats RSI or moving averages at generating signals — it doesn't operate at that level. Its real value is that it forces you to ask a different question: not "is this overbought," but "where in the overall cycle is this trend right now?" That said, the honest caveat has to come first. Wave counts drawn in hindsight almost always look perfectly clean. In real time, on the same chart, two experienced Elliotticians will frequently disagree about which wave they're looking at. Treat Elliott Wave as a framework for building a probable scenario, not a framework that hands you a certain answer.
The Five Impulse Waves and the Psychology Behind Each
Each of the five trend-direction waves maps onto a distinct phase of crowd psychology.
- Wave 1: The trend begins, but almost nobody believes it yet. Volume is usually unremarkable, and there's rarely an obvious news catalyst — this is often where the earliest, better-informed buyers accumulate.
- Wave 2: A correction that retraces a large chunk of Wave 1 — commonly 50%-61.8%, sometimes as deep as 78.6% by convention. Sentiment swings hard back toward "the rally is over," and a lot of the Wave 1 buyers get shaken out or stop themselves out. Critically, Wave 2 must never retrace past the very start of Wave 1 — that's one of the three inviolable rules covered below.
- Wave 3: Usually the longest and most powerful of the five. This is where conviction that the trend is real spreads widely, volume expands sharply, and latecomers pile in out of FOMO. In practice, most of the money made trading an impulse gets made inside Wave 3.
- Wave 4: A shallower, often choppier and more sideways corrective pause following Wave 3's sharp advance. Wave 4 must never enter the price territory of Wave 1 — the second inviolable rule.
- Wave 5: The final leg up. It's frequently weaker than Wave 3 in terms of momentum — price often prints a new high while a momentum indicator like RSI fails to confirm it, a classic bearish divergence — reflecting the last wave of optimism from the latest arrivals rather than fresh conviction.
The Three-Wave Correction: A-B-C
Once the fifth wave completes, the market corrects the entire preceding move through a three-wave structure labeled A-B-C.
- Wave A: The first leg down after the five-wave rally. Most participants at this stage still read it as a routine pullback and buy the dip.
- Wave B: A bounce that retraces part of Wave A. It can look like the uptrend resuming, but it typically fails to make a strong or convincing new high — functionally closer to a bull trap than a genuine continuation.
- Wave C: A decline comparable to or stronger than Wave A. This is usually the point where the market broadly accepts that the trend has actually turned, and late, panicked selling often shows up here.
A-B-C corrections come in several flavors — zigzags (a sharp A-B-C), flats (A, B, and C covering similar sideways ranges), and triangles (five smaller converging waves). In practice, precisely classifying which variant you're in matters less than the big-picture read: once a five-wave move completes, expect a three-legged correction before the trend resumes.
The Three Inviolable Rules
Elliott Wave has plenty of "guidelines" — tendencies that hold often but not always. It also has exactly three rules that cannot be broken. If any one of these is violated, the wave count you've drawn is wrong, full stop, and you need to relabel from scratch.
| Rule | Statement | What a violation means |
|---|---|---|
| Rule 1 | Wave 2 can never retrace beyond the starting point of Wave 1 | If it does, this isn't Wave 2 of an impulse — the whole count is invalid |
| Rule 2 | Wave 3 can never be the shortest of Waves 1, 3, and 5 | If Wave 3 looks shortest, the waves are mislabeled |
| Rule 3 | Wave 4 can never overlap the price territory of Wave 1 | Overlap means this isn't a valid impulse structure |
These aren't tendencies to weigh against other evidence — they're closer to a definition. If you're counting waves live and one of these breaks, the market didn't break the rule; you mislabeled the waves. Go back and relabel rather than forcing the count to fit.
A Practical Entry Approach: Buying the End of Wave 2 for Wave 3
The most common way traders operationalize this theory is to target entry at the start of the strongest leg — Wave 3. The sequence looks like this:
- Identify a clean, credible Wave 1 advance.
- While Wave 2 unfolds, use the retracement levels covered in Lesson 30's Fibonacci Retracement & Extension — typically 50%-61.8%, occasionally as deep as 78.6% — to estimate where it's likely to stall.
- If Wave 2 holds above the Wave 1 start (respecting Rule 1) and prints a confirmation signal — a reversal candle, a volume pickup — that zone becomes the Wave 3 entry candidate.
- Place the stop just below the Wave 1 starting point — the exact level where Rule 1 would be broken.
- Use Fibonacci extensions for targets. Wave 3 conventionally often runs to roughly 1.618 times the length of Wave 1 — this is a frequently observed tendency, not a statistically validated law, and should be treated that way explicitly.
A Worked Example
Say stock D starts Wave 1 at $30.00 and rallies to $36.00 — a $6.00 move. Wave 2 pulls back and stalls near the 61.8% retracement, $32.29 ($36.00 - $6.00 × 0.618), printing a reversal candle there.
| Item | Price | Basis |
|---|---|---|
| Wave 1 start (Rule 1 stop reference) | $30.00 | A break below here invalidates the entire count |
| Wave 2 low (entry candidate) | $32.29 | 61.8% retracement + reversal candle confirmation |
| Stop-loss | $29.90 | Just below the Wave 1 start |
| First target (Wave 3 ≈ Wave 1 × 1.618) | $41.99 | $32.29 + ($6.00 × 1.618) |
The distance from entry ($32.29) to stop ($29.90) is $2.39; the distance to the first target is $9.71 — a risk/reward ratio of roughly 1:4.1, in line with the "you don't need a high win rate if your reward is big enough" logic covered in Lesson 6's Risk/Reward & Position Sizing. That target isn't guaranteed just because 1.618 is a common ratio — it's a planning anchor for scaling out, not a promise.
Fractals: Waves Inside Waves
Another defining feature of Elliott Wave is its fractal structure. Zoom into Wave 3 on a daily chart and, on an hourly chart, it typically resolves into its own five smaller waves (1-2-3-4-5). Zoom into any leg of an A-B-C correction and you'll find a smaller impulse-and-correction structure inside it too. This fractal property is why the theory claims to apply, in principle, across every timeframe — from minute charts to multi-decade cycles.
In practice, though, the fractal property is as much a source of confusion as insight. It's very easy to mistake a small lower-timeframe correction for the start of a brand-new higher-timeframe wave. The standard discipline is to anchor your count on one primary timeframe first — establish the big-picture phase there — and only then zoom into a lower timeframe to fine-tune the entry.
Elliott Wave vs. Fibonacci Retracement: Different Tools, Different Jobs
Because the two are so often used together, they get conflated. In reality, they answer questions at different levels.
| Elliott Wave Theory | Fibonacci Retracement & Extension | |
|---|---|---|
| Question answered | Where in the trend cycle are we (Wave 1-5, or A-C)? | What's the exact retracement or target level, in price? |
| Input needed | The full structure and sequence of waves | Just one swing low and one swing high |
| Subjectivity | Relatively high — different traders can label the same chart differently | Low, once the swing points are agreed on — the math itself is objective |
| Role in a trade | Big-picture judgment: "is this early Wave 3, or late Wave 5?" | Precise entry and target prices within that phase |
| How they combine | Use wave counting to establish the phase | Use Fibonacci ratios inside that phase for the exact entry/exit levels |
Elliott Wave is the map; Fibonacci retracement is the ruler you use on that map. In practice, traders rarely rely on wave counting alone for precise entries — they use it to establish where in the cycle price sits, then layer Fibonacci ratios on top to pin down the actual entry and target.
Common Mistakes and Limitations
- Subjectivity in the count. Show the same chart to ten Elliotticians and you'll often get more than one valid-looking labeling, especially around the more variable corrective phases (Wave 2, Wave 4, A-B-C).
- Hindsight bias. After the fact, a completed wave sequence almost always looks obvious and clean. Counting waves in real time, before they've finished, is a much harder problem. Treat any count as your best current scenario, not a fixed conclusion — and be ready to relabel the instant a rule breaks.
- Betting everything on one count. Experienced practitioners keep a primary count and at least one alternate count in mind at all times. The moment Rule 1 breaks (Wave 2 retraces past the Wave 1 start), that's the signal to switch to the alternate.
- Reliability drops around illiquid names or news shocks. Earnings surprises, sudden macro headlines, and low-liquidity stocks can distort wave structure enough that clean counting becomes unreliable.
FAQ
Does Elliott Wave apply equally to every market and timeframe?
In principle, yes — its fractal nature means it's meant to apply to stocks, indices, commodities, crypto, and virtually any liquid market, on timeframes from minutes to months. In practice, low-liquidity or extremely volatile instruments tend to produce messier wave structures that are harder to count reliably.
Is Wave 3 always the strongest wave?
The most common pattern is Wave 3 being the longest and strongest of the five, but the actual rule is narrower: Wave 3 simply can't be the shortest of Waves 1, 3, and 5. Wave 1 or Wave 5 can occasionally out-run Wave 3 — what invalidates a count is specifically Wave 3 coming in as the smallest of the three.
How do you know a wave count is wrong?
The clearest signal is one of the three inviolable rules breaking. If what you thought was Wave 2 drops below the Wave 1 starting point, that decline was never Wave 2 of an impulse in the first place — the whole structure needs to be relabeled from the beginning, likely as something else entirely (such as a broader corrective move).
Summary
- Elliott Wave Theory describes markets moving through cycles of five trend-direction waves (an impulse) followed by three corrective waves (A-B-C).
- Waves 1 through 5 each map to a distinct psychological phase: disbelief, doubt, conviction, profit-taking, and late-stage optimism.
- Three inviolable rules govern any valid count — Wave 2 can't retrace past Wave 1's start, Wave 3 can't be the shortest of 1/3/5, and Wave 4 can't overlap Wave 1's territory. Break any one, and the count is wrong.
- The standard practical approach is entering near the end of Wave 2 (confirmed with Fibonacci retracement) to target the powerful Wave 3, with a stop at the level where Rule 1 would break.
- Because wave structure is fractal, the discipline is to establish the phase on a higher timeframe first, then fine-tune entries on a lower one.
- Wave counting is inherently subjective — keep a primary and an alternate count ready, and be willing to relabel immediately when a rule is violated.