Trading Strategies · Lesson 36/57 · 10 min read
Post-Earnings Announcement Drift (PEAD): Trading the Market's Slow Reaction to Earnings Surprises
In this article
- A Market Anomaly That Shouldn't Exist, But Keeps Showing Up
- Why the Market Underreacts to Earnings Surprises
- Measuring the Surprise: Standardized Unexpected Earnings (SUE)
- Building a PEAD Screen
- A Worked Trade Walkthrough
- PEAD vs. General Momentum Trading
- Why an Anomaly This Well-Known Hasn't Been Arbitraged Away
- Limitations and Pitfalls
- FAQ
- Summary
A Market Anomaly That Shouldn't Exist, But Keeps Showing Up
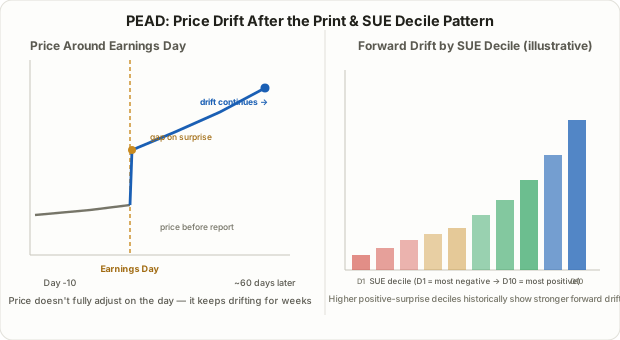
Efficient-market theory says a stock's price should absorb new information almost instantly — the moment a company reports earnings, the price should jump (or drop) to the new "correct" level and then move randomly from there. Post-Earnings Announcement Drift (PEAD) is the well-documented pattern that breaks that assumption: after a company reports earnings that meaningfully beat (or miss) expectations, the stock tends to keep drifting in the same direction for weeks to months afterward, instead of settling immediately.
This isn't a fringe theory. It was first documented by Ball and Brown in 1968 and has been re-tested across decades of data and market conditions since — one of the most replicated anomalies in all of academic finance. It's also distinct from the general momentum trading covered in Lesson 2: momentum trading rides any stock with strong recent price and volume trend, regardless of cause, while PEAD is anchored specifically to a fundamental catalyst — the size of the earnings surprise itself — and to the specific window that follows an earnings release. Think of PEAD as a narrower, catalyst-driven cousin of momentum, not a duplicate of it.
Why the Market Underreacts to Earnings Surprises
If information gets priced in instantly, PEAD shouldn't exist. The leading explanations for why it does are all versions of the same idea: the market doesn't process a surprise as fast, or as completely, as theory assumes.
- Anchoring and slow belief revision. Analysts and investors anchor to their prior expectations and adjust their models toward the new reality gradually rather than all at once. A single beat doesn't instantly convince everyone the company's trajectory has genuinely changed.
- Analyst estimate revision lag. Sell-side analysts typically update full-year estimates over several days to weeks after a print, not within minutes. As estimates get revised upward following a beat, that revision itself becomes a fresh source of buying pressure spread out over time.
- Investor attention constraints. Thousands of companies report earnings every quarter, and most investors and even algorithms can't fully digest every filing on the day it lands. Less-followed, smaller-cap names in particular can take longer for the full informational content of a beat to reach the market.
- Institutional trading constraints. Large funds often can't build a full position in one session without moving the price against themselves, so buying (or selling) in response to a surprise gets spread out mechanically over subsequent days.
None of these are irrational actors — they're structural frictions in how information actually diffuses through a market made of real institutions and real attention limits, not the frictionless instant-adjustment machine assumed in textbook efficient-market theory.
Measuring the Surprise: Standardized Unexpected Earnings (SUE)
To trade PEAD systematically, you first need a consistent way to measure how big a "surprise" actually was — a raw earnings-per-share beat of $0.05 means something very different for a volatile small-cap than for a stable large-cap. That's what SUE (Standardized Unexpected Earnings) does: it expresses the surprise in standard-deviation units, so surprises are comparable across different stocks.
A common form of the formula:
SUE = (Actual EPS − Expected EPS) ÷ σ(historical surprise)
Where expected EPS is the analyst consensus estimate (or, in an older academic version, the EPS from four quarters ago), and σ is the standard deviation of that company's own past earnings surprises over a lookback window (commonly the trailing 8–20 quarters). Dividing by the company's own historical surprise volatility is the key step — it prevents a stock that's always noisy from looking artificially "extreme" every quarter.
A worked example:
| Item | Value |
|---|---|
| Actual EPS this quarter | $1.20 |
| Consensus estimate | $1.05 |
| Raw surprise | +$0.15 |
| Standard deviation of past 12 quarterly surprises | $0.10 |
| SUE | 0.15 ÷ 0.10 = 1.5 |
A SUE of 1.5 means this quarter's surprise was one and a half standard deviations above what this particular company's own history of surprises would suggest — a genuinely large beat for that stock, even though $0.15 alone tells you almost nothing without the context. Traders commonly bucket SUE into deciles or simply flag anything with |SUE| above roughly 1–2 as a candidate worth screening further; this threshold is a widely used convention in both academic studies and retail screening tools, not a regulatory or universally fixed rule.
Building a PEAD Screen
A workable PEAD screen usually combines several conditions rather than trading on SUE alone:
| Filter | Common convention | Why it matters |
|---|---|---|
| SUE magnitude | |SUE| above roughly 1–2 | Separates a meaningful surprise from routine noise |
| Day-of / next-day price reaction | Stock also moves in the surprise's direction with above-average volume | Confirms the market is actually reacting to the number, not ignoring it |
| Market capitalization | Small- and mid-cap names screened for or weighted more heavily | Academic work consistently finds the drift is strongest where analyst coverage and institutional attention are thinnest |
| Liquidity | Minimum average daily dollar volume | Ensures the position can actually be entered and exited without excessive slippage |
| Guidance direction | Company also raised (not just beat) guidance | A raise adds a second, independent signal that the surprise reflects a real change, not a one-off item |
The guidance filter is worth dwelling on. A beat driven by a one-time tax credit or an asset sale is a very different surprise from a beat driven by stronger underlying demand — and a company that beats and raises forward guidance is telling you management itself believes the improvement is durable. Screening for both tends to filter out a meaningful share of "beat but immediately faded" cases.
A Worked Trade Walkthrough
Consider a hypothetical mid-cap software company, Stock D, trading at $60 heading into earnings. It reports EPS of $1.20 against a $1.05 consensus (the same SUE = 1.5 example above), also raises full-year guidance, and the stock closes up 9% on the report day with volume three times its 20-day average — a clean confirmation of the filters above. A trader following a rules-based PEAD approach might enter a partial position on Day 2 (after the initial post-earnings volatility settles), sized according to the risk framework from Lesson 6 on risk/reward and position sizing, with a stop placed below the post-earnings gap-up level — a level that, if broken, would suggest the drift thesis has failed rather than just paused. Academic studies commonly frame the PEAD holding window as roughly 60–90 trading days following the report, after which the informational edge of that specific surprise is generally considered to have played out; this window is itself a convention drawn from where researchers have found the effect concentrated, not a fixed rule that guarantees an exit date.
PEAD vs. General Momentum Trading
Both strategies buy strength and hold through continuation, which makes them easy to conflate. The distinction is in what triggers the trade and how the holding period is defined.
| Aspect | PEAD | General Momentum Trading (Lesson 2) |
|---|---|---|
| Entry trigger | A quantified earnings surprise (SUE) plus confirming price/volume reaction | Any stock showing strong recent price trend and relative strength, regardless of cause |
| Catalyst requirement | Explicit — must be tied to an earnings release | None required — can be sector rotation, news, technical breakout, or nothing identifiable at all |
| Holding period | Bounded to a specific post-earnings window, commonly cited around 60–90 trading days | Open-ended — held as long as the trend and momentum indicators stay favorable |
| Re-entry logic | New signal only arrives at the next quarterly report | Continuously re-evaluated on rolling price/volume data |
| Underlying academic basis | Underreaction to a specific, dated piece of fundamental information | Continuation of existing price trends, with several competing behavioral explanations |
In practice, some traders combine both: using PEAD to select which earnings-driven movers to focus on, then applying standard momentum and trend tools to manage the position once it's on.
Why an Anomaly This Well-Known Hasn't Been Arbitraged Away
A fair question: if PEAD has been documented since 1968, why hasn't it disappeared as more people trade on it? The honest answer is that it has partially shrunk in the most liquid, heavily-covered large-cap names, but several structural "limits to arbitrage" keep it alive elsewhere:
- Transaction costs eat into a slow-moving edge. A drift measured in a few percentage points spread over months is fragile against bid-ask spreads, commissions, and slippage — especially in the smaller, less-liquid names where the effect is strongest.
- Capacity constraints. The stocks with the clearest drift tend to be smaller-cap, lower-volume names. A large fund simply can't deploy meaningful capital into them without moving the price and eroding the edge itself.
- It requires patience institutional capital often doesn't have. A 60–90 day hold on a single-stock, catalyst-specific thesis doesn't fit cleanly into quarterly performance reporting cycles for many funds, which reduces the amount of capital actively arbitraging it away.
None of this means the edge is guaranteed to persist — anomalies can and do decay as more systematic capital targets them, and the net-profit filter approach from Lesson 13 (accounting for real fees and slippage before assuming an edge is tradeable) applies especially directly here, given how much of PEAD's theoretical edge sits in small, cost-sensitive names.
Limitations and Pitfalls
- The next earnings report can reverse everything. If the company's next quarterly print disappoints, several months of drift can unwind quickly — this is a catalyst-bound trade, not a permanent repricing.
- Small-cap concentration cuts both ways. The stocks with the cleanest historical drift are also the ones with the widest spreads, thinnest liquidity, and highest single-stock risk.
- One-time items distort the surprise. A beat driven by a tax benefit, litigation settlement, or asset sale can trigger the same SUE signal as a genuine operational improvement — always check what actually drove the beat, not just the number.
- Guidance quality varies by company and sector. Some companies routinely sandbag guidance to make future beats easier; that pattern, once identified for a given stock, should adjust how much weight you put on any single quarter's "surprise."
- This is a statistical tendency across many trades, not a per-trade guarantee. Academic studies report averages across large samples; any single earnings-surprise trade can still lose regardless of how clean the SUE signal looked going in.
FAQ
Is PEAD the same as just buying a stock after a good earnings beat?
Not quite. Simply reacting to "good news" ignores magnitude and context. PEAD specifically screens for a statistically large surprise relative to that company's own historical surprise pattern (via SUE), confirmed by price and volume reaction — not every earnings beat qualifies, and a small beat that was already expected by the market typically shows little to no drift.
How long should a PEAD position be held?
There's no fixed rule, but academic studies commonly find the drift concentrated in roughly the 60–90 trading days following the report, which is the window most rules-based approaches use as a starting reference — not a guarantee that the edge ends precisely on a given day.
Does PEAD work on large, heavily-covered stocks like mega-cap tech?
The effect has historically been documented as weaker in large, widely-covered names, since more analyst attention and trading volume tends to price in a surprise faster. Most of the literature finds the drift concentrated in smaller- and mid-cap stocks with thinner analyst coverage, which is also where transaction costs and liquidity risk are highest.
Summary
- Post-Earnings Announcement Drift (PEAD) is the tendency for a stock to keep moving in the direction of an earnings surprise for weeks to months, rather than fully repricing on the announcement day — one of the most replicated anomalies in academic finance since Ball and Brown's original 1968 study.
- The likely cause is underreaction: analysts revise estimates gradually, investor attention is limited, and large funds can't build full positions in a single session, so the market's adjustment to genuinely new information gets spread out over time.
- SUE (Standardized Unexpected Earnings) measures a surprise in standard-deviation units relative to that company's own history, making surprises comparable across different stocks; |SUE| above roughly 1–2 is a common (not official) screening threshold.
- A workable screen combines SUE magnitude with confirming price/volume reaction, a guidance raise, and a market-cap/liquidity filter — smaller, less-covered names historically show the strongest and most persistent drift.
- PEAD differs from general momentum trading by requiring a specific, dated fundamental catalyst and a bounded holding window, rather than trading any stock with favorable price trend indefinitely.
- The edge persists partly because transaction costs, capacity constraints, and reporting-cycle mismatches make it hard for large capital to fully arbitrage away in the smaller names where it's strongest — but it's a statistical tendency, not a guarantee on any single trade, and a bad next-quarter report can reverse the drift quickly.