Trading Strategies · Lesson 35/57 · 10 min read
Market Breadth Trading: Reading the Advance-Decline Line and McClellan Oscillator to Gauge a Rally's True Strength
In this article
- The Index Hits New Highs — So Why Is Your Portfolio Flat?
- The Advance-Decline Line: Counting Stocks Instead of Dollars
- The McClellan Oscillator: Measuring How Fast Breadth Is Changing
- Why It Works: The Index Measures Dollars, Breadth Measures Participants
- Reading Signals: Divergence and Breadth Thrust
- The McClellan Summation Index: Zooming Out
- A Worked Example
- A-D Line vs. the Index: Two Different Lenses on the Same Market
- FAQ
- Limitations and Caveats
- Summary
The Index Hits New Highs — So Why Is Your Portfolio Flat?
Anyone who's watched the S&P 500 grind out fresh record highs while their own basket of stocks sits dead flat for months has run into a real quirk of how most indices work. Because major indices are market-cap weighted, a handful of the largest companies can drag the entire index to a new high even while hundreds or thousands of smaller names are quietly losing ground — and none of that shows up if you're only staring at the index chart. Through 2026, markets have swung between stretches where a small cluster of mega-cap tech names accounted for most of the index's gains, and stretches where leadership broadened into energy, industrials, and materials — and "how wide is this rally, really?" has become a recurring question traders are asking.
Market breadth indicators exist to answer exactly that. Instead of measuring price, they count something much simpler — how many stocks went up today versus how many went down — and that count exposes participation the index alone can't show. This lesson covers the two most widely used breadth tools: the Advance-Decline Line (A-D Line) and the McClellan Oscillator.
The Advance-Decline Line: Counting Stocks Instead of Dollars
The A-D Line's construction is deliberately simple. Every trading day, you subtract the number of declining stocks from the number of advancing stocks (net advances), then add that number to a running cumulative total.
Net advances (today) = advancing issues − declining issues
A-D Line (cumulative) = yesterday's A-D Line + today's net advances
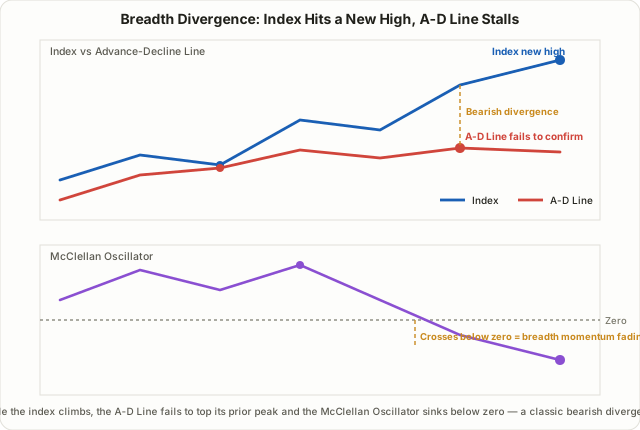
The absolute cumulative value carries no meaning on its own — it depends entirely on where you started counting. What matters is the slope and direction of the line, and specifically whether it's tracking the index in the same direction. When the index climbs and the A-D Line is also making new highs alongside it, that rally has broad participation across most of the market rather than a handful of names carrying it. When the index prints a new high but the A-D Line stalls or rolls over instead of confirming it, fewer and fewer stocks are actually driving the advance — a pattern known as bearish divergence.
The McClellan Oscillator: Measuring How Fast Breadth Is Changing
Where the A-D Line shows the direction of breadth, the McClellan Oscillator, developed in 1969 by the husband-and-wife team of Sherman and Marian McClellan, measures the momentum behind that direction — how quickly breadth is strengthening or weakening. It's built by taking two exponential moving averages (EMAs) of net advances over different lookback periods and subtracting one from the other.
McClellan Oscillator = 19-day EMA of net advances − 39-day EMA of net advances
The 19-day and 39-day windows are the conventional values the original developers settled on. A reading above zero means short-term (19-day) breadth is running stronger than intermediate-term (39-day) breadth; below zero means the opposite. Many traders treat a cross above zero as a short-term bullish tilt and a cross below zero as bearish — but it's worth being explicit that this is a commonly used filter rather than a validated, standalone trading rule.
Why It Works: The Index Measures Dollars, Breadth Measures Participants
A cap-weighted index and a breadth indicator define "market strength" in fundamentally different terms. The index tracks how much money is moving; breadth tracks how many stocks — and by extension, how many different positions — are moving in the same direction at the same time. When the two agree, there's nothing to reconcile. When they diverge, that gap itself becomes information.
A pattern shows up repeatedly late in market cycles. Early in a bull run, most stocks rise together, and the index and the A-D Line make new highs side by side. As the cycle matures, capital tends to concentrate into a smaller group of already-proven mega-cap growth names, while smaller or less-certain names quietly start falling out of the advance one by one. At that point the index keeps climbing on the strength of a shrinking group of leaders, while the actual count of advancing stocks shrinks — so the A-D Line stops confirming the index. The number of pillars holding the market up is thinning out, and when even a few of those remaining pillars wobble, the index can fall much faster than the earlier breadth deterioration would have suggested. That's the logic behind treating breadth divergence as an early-warning signal — but it's a probabilistic tendency, not a fixed causal rule, and it isn't unusual for a divergence to persist unresolved for weeks or even months before anything happens.
Reading Signals: Divergence and Breadth Thrust
There are two main ways breadth indicators get used in practice.
Bullish and bearish divergence. When the index prints a new high but the A-D Line or McClellan Oscillator fails to confirm it, that's a bearish divergence. When the index prints a new low but breadth holds up better than it did at the prior low, that's a bullish divergence — often read as a sign that selling pressure is drying out near a bottom, the mirror image of fading momentum near a top.
Breadth thrust signals. Coined by the legendary investor Martin Zweig, a breadth thrust occurs when the 10-day moving average of the daily ratio of advancing stocks surges from below 40% to above 61.5% within a short window — traditionally cited as 10 trading days. The idea is that this kind of rapid swing from extreme pessimism to extreme optimism reflects a very wide swath of the market getting bought at once, and historically, strong rallies have often followed this kind of sharp reversal. That said, the 40%, 61.5%, and 10-day figures are Zweig's original empirical thresholds — the number of historical occurrences is small, and market structure and index composition have both changed substantially since he first defined the signal, so treat it as a rule of thumb rather than a fixed law.
The McClellan Summation Index: Zooming Out
Cumulatively adding up the daily McClellan Oscillator values produces the McClellan Summation Index. Where the oscillator is built to catch short-term swings in momentum, the Summation Index shows the intermediate-to-long-term trend that momentum accumulates into. A Summation Index that's been climbing steadily suggests breadth has been improving over a span of weeks; a rollover suggests an intermediate-term breadth deterioration is underway. In practice, many traders use the oscillator for short-term timing and the Summation Index to confirm the broader phase they're in.
A Worked Example
Instead of the full 19-day/39-day EMA math, here's a simplified five-day walkthrough of how net advances accumulate. Assume a total of 3,000 listed issues on the exchange.
| Day | Advancing | Declining | Net Advances | A-D Line (cumulative) |
|---|---|---|---|---|
| Day 1 | 1,650 | 1,200 | +450 | +450 |
| Day 2 | 1,700 | 1,150 | +550 | +1,000 |
| Day 3 | 1,400 | 1,450 | −50 | +950 |
| Day 4 | 1,100 | 1,750 | −650 | +300 |
| Day 5 | 950 | 1,900 | −950 | −650 |
Suppose the index itself is still up slightly from Day 1 to Day 5. Looking only at the index, it reads as an unremarkable, mildly positive week. But the A-D Line collapsed from +1,000 to −650 over the same stretch. That tells a different story: the handful of large-cap names propping up the index are holding, while the rest of the market started getting sold hard from Day 3 onward — a textbook early-stage bearish divergence. In practice nobody does this arithmetic by hand; charting platforms like TradingView and StockCharts calculate the A-D Line and McClellan Oscillator automatically for each exchange.
A-D Line vs. the Index: Two Different Lenses on the Same Market
| Cap-Weighted Index (e.g., S&P 500) | Advance-Decline Line (Breadth) | |
|---|---|---|
| What it measures | Weighted by market cap — bigger companies matter more | Every stock counts equally, one vote each |
| Effect of mega-cap concentration | A few giants can carry the whole index | Doesn't move unless the number of advancing stocks grows |
| What it tells you | How much money is flowing into the market | How wide the participation in that move is |
| Weak spot | Can mask a shrinking number of participating stocks | Doesn't capture magnitude — a 5% mega-cap gain and a 5% small-cap gain count the same |
| Best used for | Tracking actual portfolio-level gains and losses | Judging how durable a rally (or selloff) is likely to be |
The two aren't substitutes — they're complements. The index tells you where the market is; breadth tells you how solid the ground under that position actually is. Lesson 26's RRG Sector Rotation Strategy captures where capital is concentrating using relative strength across sectors; market breadth sits one level above that, capturing how widely capital is spread across the entire market — a related but distinct question.
FAQ
Should I check the A-D Line or the McClellan Oscillator first?
There's no fixed order, but a natural workflow is to check the A-D Line first for the big picture — is a divergence present at all? — then use the McClellan Oscillator to see whether that divergence has been getting worse or easing recently. The Summation Index is typically layered on top of both to confirm the broader intermediate-term phase.
Should I sell the moment I spot a divergence?
No. A bearish divergence is a warning flag, not an immediate sell signal. It isn't unusual for a divergence to persist for weeks or months while the index keeps grinding higher regardless. Breadth indicators work best as a risk-management overlay alongside the stop-loss and position-sizing discipline covered in Lesson 6's Risk/Reward Ratio and Money Management, not as a standalone trigger.
Do these thresholds (like the 61.5% breadth thrust level) work the same way on every exchange?
The underlying mechanics apply to any exchange that publishes daily advancing/declining counts. But the specific numeric thresholds — 61.5% for a breadth thrust, for example — were derived from U.S. market history and may not transfer cleanly to markets with different numbers of listed issues, different retail participation levels, or different sector composition. It's worth backtesting a given threshold against the specific market you're trading before relying on it.
Limitations and Caveats
- It's a lagging tool. The Summation Index in particular is a cumulative value, so its turns often trail the actual underlying shift in trend rather than leading it in real time.
- Divergence is an early warning, not a confirmed signal. As noted above, divergences can persist unresolved for a long time. Holding a bearish position purely because a divergence exists, while it drags on for months, can be its own source of losses.
- Results depend on the universe you're measuring. The shape of the A-D Line changes depending on which exchange and which set of listed issues you're counting. Always compare breadth calculated over the same universe as the index you're evaluating it against.
- It's a confirmation tool, not an entry signal. Breadth tells you how broad-based a move is — it doesn't tell you when to buy or sell an individual stock. Actual entries and exits still need to be based on price action, volume, and your own risk rules.
Summary
- Cap-weighted indices can mask a shrinking pool of participating stocks; breadth indicators count how many stocks are actually advancing and declining to reveal how wide a rally really is.
- The Advance-Decline Line is a running cumulative total of net advances — what matters is its direction relative to the index (confirmation or divergence), not its absolute value.
- The McClellan Oscillator subtracts a 39-day EMA of net advances from a 19-day EMA to measure breadth momentum, with a cross above or below zero commonly used as a reference signal.
- A breadth thrust — the 10-day average advance ratio surging from below 40% to above 61.5% in a short window — is Martin Zweig's empirical signal for a shift from extreme pessimism to optimism, though the historical sample is small.
- The McClellan Summation Index cumulates the oscillator to show the intermediate-to-long-term breadth trend, typically used alongside the oscillator's shorter-term timing.
- All breadth indicators are lagging, confirmation-oriented tools whose divergences can stay unresolved for a long time — always pair them with price action and a defined stop-loss discipline.