Trading Strategies · Lesson 60/60 · 8 min read
Put-Call Ratio Trading: Reading Options Market Fear and Greed Extremes
In this article
- "Be Fearful When Others Are Greedy" — But How Do You Actually Measure Fear?
- How the Put-Call Ratio Is Calculated
- A Worked Example
- Why Extremes Get Read as Contrarian Signals: The Market Mechanics
- Commonly Cited Reference Bands
- PCR vs. VIX: Both Called "Fear Gauges," But Different Things
- Not to Be Confused with GEX or Max Pain
- Practical Cautions
- Frequently Asked Questions
- Summary
"Be Fearful When Others Are Greedy" — But How Do You Actually Measure Fear?
Everyone's heard the line: be fearful when others are greedy, greedy when others are fearful. The hard part is never the advice — it's figuring out, on any given day, whether the market is actually in one of those extremes. Headlines and forum sentiment are lagging and subjective. Options markets, on the other hand, are where traders put real money behind a directional view every single day, which makes them one of the more direct windows into collective positioning. The put-call ratio (PCR) compresses that options activity into a single number: how much put buying is happening relative to call buying, right now.
This lesson walks through exactly how PCR is calculated, why extreme readings get treated as contrarian signals, how it differs from VIX term structure (Lesson 28) and gamma exposure (Lesson 15), and how to actually use — and not misuse — this indicator in practice.
How the Put-Call Ratio Is Calculated
The math is simple. Take total put volume traded over a period (usually one day) and divide it by total call volume for that same period.
PCR = Put volume ÷ Call volume
- PCR above 1: put trading outweighs call trading — read as a sign of bearish positioning or hedging demand.
- PCR below 1: call trading outweighs put trading — read as a sign of bullish positioning or optimism.
- PCR near 1: put and call demand are roughly balanced.
Two versions are in common use: a volume-based ratio (contracts traded that day) and an open-interest-based ratio (contracts currently outstanding). Volume-based PCR reacts faster to same-day sentiment shifts, while open-interest-based PCR reflects accumulated positioning over time. The most widely cited version is the CBOE Total Put/Call Ratio (ticker $CPC), a volume-based ratio combining both index and single-stock options; CBOE also publishes separate index-only and equity-only ($CPCE) versions.
A Worked Example
Take a hypothetical trading day on a major index options market with the following volume:
| Category | Contract volume |
|---|---|
| Total put volume | 1,850,000 |
| Total call volume | 1,340,000 |
PCR = 1,850,000 ÷ 1,340,000 ≈ 1.38
A single number in isolation doesn't tell you much — what matters is how it compares to the recent average. The CBOE Total Put/Call Ratio has historically averaged somewhere around 0.9–0.95 based on data going back to 2007, so a reading of 1.38 sits meaningfully above that baseline, signaling an unusually heavy day of put demand. That average, and the range around it, shifts with the broader market regime, so treat every specific number in this lesson as a commonly cited rule of thumb — not a fixed law.
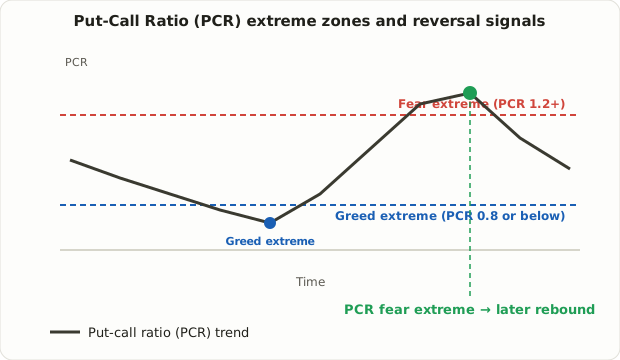
Why Extremes Get Read as Contrarian Signals: The Market Mechanics
PCR earns its place as a contrarian tool because it captures crowd positioning across the entire market, not any single trader's view.
- Extremely high PCR (heavy put demand): this can mean most of the traders who wanted downside protection or a bearish bet have already positioned for it. With fewer potential new sellers left to act, selling pressure can run dry, and even modest good news can trigger short covering or a bounce. This is the mechanical basis behind "extreme fear often shows up near a bottom."
- Extremely low PCR (heavy call demand): the mirror case — most of the crowd that wanted upside exposure has already bought in. With less fresh buying power left to add, a small negative surprise can trigger a pullback more easily than it would in a balanced market.
This isn't a mechanical rule that "sentiment extremes always reverse." It's closer to a structural argument: when a crowd leans heavily one way, there are relatively fewer new participants left to extend that lean. An actual reversal still needs confirmation from price action, volume, or other evidence before you'd act on it.
Commonly Cited Reference Bands
The numbers below are rules of thumb repeated across traders and data providers, not fixed thresholds — treat them as "worth paying closer attention here," not as trade triggers on their own.
| PCR range (CBOE Total) | Typical interpretation |
|---|---|
| Roughly 0.7 or below | Heavy call skew, greed extreme — watch for upside exhaustion or a short-term pullback |
| Roughly 0.8–1.0 | Neutral to mildly bullish, normal range |
| Roughly 1.0–1.2 | Neutral to mildly bearish, normal range |
| Roughly 1.2 or above | Heavy put skew, fear extreme — watch for selling exhaustion or a bounce |
Some traders smooth out single-day noise with a 5-day or 10-day moving average of PCR. A single session's ratio can swing sharply on one large institutional hedge trade, so the smoothed version is generally considered a more reliable read on the underlying trend.
PCR vs. VIX: Both Called "Fear Gauges," But Different Things
PCR and VIX are both loosely labeled "fear indexes" in financial media, which leads people to treat them as interchangeable. They aren't.
| Put-Call Ratio (PCR) | VIX | |
|---|---|---|
| What it measures | Actual traded volume (or open interest) ratio of puts to calls | Aggregate implied volatility priced into S&P 500 options |
| What it captures | Directional positioning — which way the crowd is betting | Expected magnitude of future price moves — direction-agnostic |
| How it's read | Relative to its own recent band, not a fixed absolute level | Often read on absolute level too (e.g., under 20 = calm, over 30 = fearful) |
| Rising reading means | More bearish bets or hedging demand (directional pessimism) | Bigger expected price swings ahead (in either direction) |
| Related lesson | This lesson | Lesson 28: VIX Term Structure |
Don't treat the two as the same signal. PCR can spike to an extreme while VIX stays relatively contained — a state worth reading as "the crowd is leaning bearish, but the market isn't pricing a violent move to get there," which is a meaningfully different read than "everyone is panicking." When both PCR and VIX spike together, that combination is generally treated as a stronger fear signal than either alone.
Not to Be Confused with GEX or Max Pain
GEX (Lesson 15) and Max Pain (Lesson 57) also derive from options data and get mentioned in the same breath as PCR, but the three answer entirely different questions.
- PCR answers: "how bearish or bullish is the crowd positioned right now?" — a pure sentiment and positioning metric.
- GEX answers: "how much buying or selling will dealers need to do to stay hedged?" — a hedge-flow mechanism metric.
- Max Pain answers: "which strike minimizes the payout to option buyers at expiration?" — a settlement-value metric.
All three start from the same raw options chain data, but PCR is measuring sentiment, GEX is measuring hedge flow, and Max Pain is measuring settlement payout — they're complements, not substitutes for one another.
Practical Cautions
- Never trade it as a standalone signal. Jumping into the opposite position the moment PCR hits an extreme is a common way to get run over. In the early stages of a real downtrend, PCR frequently sits at an extreme reading for days or even weeks while it climbs even higher and price keeps falling. To avoid catching a falling knife, wait for confirming evidence — a reversal candle, rising volume near a support level, or similar price-based confirmation.
- Single-stock PCR is noisier than index PCR. An individual name's put-call ratio can be skewed by large collar hedges or M&A-arbitrage options flow that has nothing to do with a directional bet on the stock. This is a core reason index-level PCR is generally considered more reliable than single-stock PCR.
- The proliferation of short-dated weekly options has muddied the signal somewhat. As short-term expirations have taken up a larger share of total volume, more of that volume reflects short-term hedging and arbitrage activity rather than pure directional betting, which most practitioners view as having diluted PCR's reliability as a pure sentiment gauge compared to prior years.
- The baseline itself drifts with the market regime. During extended bull markets, the "normal" PCR band tends to shift lower; during extended bear markets, it tends to shift higher. Rather than anchoring to an absolute threshold from years-old data, most practitioners judge extremes relative to the trailing 3–6 months of readings.
Frequently Asked Questions
Should I buy every time PCR crosses 1.2?
No. 1.2 is a widely cited reference band, not a mechanical buy trigger. In the early stages of a strong downtrend, PCR commonly pushes past 1.2 and keeps climbing while price keeps falling for an extended stretch. Treat an extreme reading as "this zone deserves attention," and pair it with independent confirmation of an actual price reversal before acting.
Should I look at CBOE Total PCR or Equity PCR?
It depends on the purpose. Total PCR ($CPC), which combines index and single-stock options, gives a broader read on overall market sentiment. Equity PCR ($CPCE), limited to single-stock options, is sometimes viewed as leaning more toward directional retail-style betting since it carries relatively less large-scale index hedging. Neither one perfectly isolates pure directional positioning, so many traders watch both together.
Where can I check the put-call ratio?
CBOE publishes Total, Index, and Equity put-call ratios on its website daily. Most brokerage platforms and financial data sites also chart historical PCR alongside price for easy comparison.
Summary
- The put-call ratio (PCR) divides put volume by call volume to compress options-market sentiment — bearish vs. bullish crowd positioning — into a single number.
- Readings well above the normal band (roughly 1.2 and up is a commonly cited threshold) suggest extreme pessimism; readings well below it (roughly 0.7–0.8 and under) suggest extreme optimism, and contrarian traders watch these extremes as potential reversal setups.
- The underlying logic is structural, not magical: when a crowd leans heavily one direction, fewer new participants remain to extend that lean further — this is not an absolute "always fade the extreme" rule.
- VIX measures expected volatility magnitude (direction-agnostic), GEX measures dealer hedge flow, and Max Pain measures expiration settlement value — each answers a different question than PCR's pure sentiment read, and the four should be treated as complementary, not interchangeable.
- Never trade PCR extremes in isolation; confirm with price action and volume, and remember that the "normal" band itself shifts with the broader market regime.