Trading Strategies · Lesson 14/57 · 7 min read
TTM Squeeze (Bollinger-Keltner Squeeze): Timing Breakouts After Volatility Compression
In this article
- A Different Question: "When" Does Volatility Explode?
- What a Squeeze Is: A Signal Born From Two Different Bands
- Why the Squeeze Is a Meaningful Signal
- It Doesn't Tell You Direction: The Momentum Histogram
- Rules Traders Commonly Use (Convention, Not Fixed Law)
- Limitations of Squeeze Trading
- How It Compares to Other Lessons
- Summary
A Different Question: "When" Does Volatility Explode?
Lesson 3 used Bollinger Bands as a mean-reversion tool — how far has price strayed outside the band. Lesson 13 used ATR as a risk filter — how wide should the stop distance be. This lesson combines the two for a completely different purpose: instead of asking where price currently sits, it asks how tight the bands themselves have gotten, to flag a moment where a big move is more likely to be coming.
Popularized by trader John Carter and commonly known as the "TTM Squeeze," this concept still gets steady mileage in retail trading communities and trading-education content as a go-to way to time volatility breakouts.
What a Squeeze Is: A Signal Born From Two Different Bands
The technique overlays two volatility bands built with fundamentally different math.
- Bollinger Bands (the inner band): a 20-period simple moving average (SMA) plus/minus 2 standard deviations. Because it's directly built from price's actual dispersion (standard deviation), it's sensitive and reacts quickly to changes in volatility.
- Keltner Channel (the outer band): a 20-period exponential moving average (EMA) plus/minus 1.5x the Average True Range (ATR, typically 14-20 periods). ATR moves more smoothly than standard deviation, so the Keltner Channel reacts more slowly and stays comparatively stable.
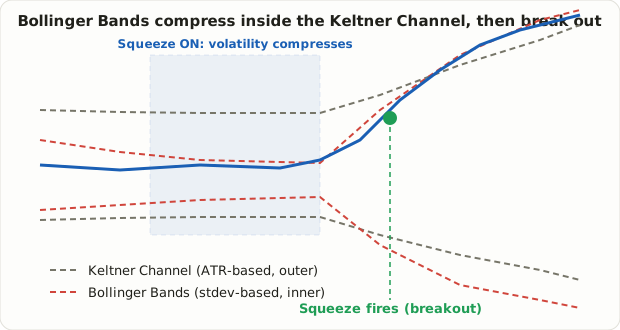
Normally the two bands' widths move somewhat independently. But when a market grinds sideways in a tight range for days to weeks and volatility drops sharply, the fast-reacting Bollinger Bands contract more aggressively than the slower Keltner Channel. At that point, the Bollinger Bands can end up fully inside the Keltner Channel — this state is called "Squeeze On." When volatility later expands and the Bollinger Bands push back outside the Keltner Channel, that's the "squeeze fired" (or "squeeze off") moment.
Why the Squeeze Is a Meaningful Signal
There are two reasons traders pay attention to this pattern rather than treating it as coincidence.
- Volatility tends to cluster. Quiet periods tend to be followed by more quiet periods, and volatile periods by more volatility — a pattern widely observed across financial time series. The fact that volatility is unusually low right now can itself be read as a signal that it's more likely to revert toward its normal level. That said, this is a statistical tendency, not a guarantee that a squeeze resolves into a directional move within any fixed timeframe.
- Market psychology. A tight range persisting for a long stretch means buyers and sellers are locked in a close balance — neither side has enough conviction to push price decisively. That balance doesn't last forever. The moment one side gains the upper hand, stop-outs on the other side, short covering, and chasing from sidelined capital tend to pile on and accelerate the move. It's often described with the "the harder you compress a spring, the harder it snaps back" analogy.
💡 Squeezes often coincide with periods of falling implied volatility (IV) in the options market — one reason options traders, who directly trade volatility itself, also watch this indicator closely.
It Doesn't Tell You Direction: The Momentum Histogram
A squeeze by itself only tells you "a big move is more likely soon" — not which way it will go. To gauge direction, John Carter paired the squeeze with a momentum histogram, calculated roughly as follows.
- Take the average of the recent 20-bar (highest high + lowest low)/2 (a Donchian midline) and the 20-period SMA of closes, then average those two together — this is the "baseline."
- Subtract this baseline from the current close, then smooth that value over the last 20 bars using linear regression.
- Plot the result as a bar (histogram). Above zero reads as bullish momentum; below zero reads as bearish.
In practice, traders tend to watch whether the bars are growing or shrinking, and whether the color flips rather than the precise numeric value. For example, growing positive bars are commonly read as strengthening bullish momentum, while positive bars that start shrinking are commonly read as fading bullish strength.
Rules Traders Commonly Use (Convention, Not Fixed Law)
The table below reflects conventions widely used among traders — not fixed rules that always hold. Always validate against your own market, timeframe, and instrument before applying them live.
| Situation | Common interpretation |
|---|---|
| Squeeze stays on | Still waiting. No direction established yet — watch as a candidate, don't position |
| Squeeze fires + histogram turns positive | Candidate for a bullish breakout — though price may have already moved somewhat by this point, carrying chase-entry risk |
| Squeeze fires + histogram turns negative | Candidate for a bearish breakout |
| Squeeze fires but histogram stays near zero | Possible directionless false signal — watching is generally preferred |
Stops are typically placed at the opposite side of the Keltner Channel (e.g., the channel's lower band for a bullish breakout), or at the opposite edge of the range that formed during the squeeze. Viewed through the risk/reward lens from Lesson 6, a tighter squeeze range tends to produce a tighter stop and therefore a more favorable risk/reward structure — though, as with the Lesson 13 filter, the stop still needs to stay wider than noise level as a minimum condition.
Limitations of Squeeze Trading
- False squeezes (fakeouts). It's not uncommon for a squeeze to fire without a directional move ever materializing, snapping back into a tight range instead. Rather than treating "squeeze fired" alone as an absolute entry trigger, it's common practice to confirm with rising volume or another trend indicator.
- Timeframe dependence. How often and when a squeeze appears changes drastically depending on which timeframe you're watching (5-minute, hourly, daily). On a daily chart a squeeze might be a rare event that shows up once every few weeks; on a 5-minute chart it can fire several times a day, and reliability tends to drop accordingly.
- Lag. Because the momentum histogram is smoothed via linear regression, it reacts a beat later than raw price. It's common for a squeeze to fire and price to have already moved a meaningful amount before the histogram's direction is confirmed.
- It doesn't explain why the range formed. The indicator alone can't tell you whether volatility dropped because the market is waiting on an earnings release, a macro event, or simply thin liquidity. Context still matters.
How It Compares to Other Lessons
| Lesson 3: Mean Reversion (Bollinger Bands) | Lesson 11: Donchian/ORB Breakout | Lesson 14: Bollinger-Keltner Squeeze | |
|---|---|---|---|
| What it watches | How far price has moved outside the band | Whether price has cleared a defined range (N bars / opening range) | How tight the bands themselves have become |
| The core question | "Where" does it revert from? | "What" must be broken for a signal? | "When" is volatility more likely to explode? |
| Direction | The band itself implies direction (fade the extreme) | Breakout direction is the entry direction | A squeeze alone gives no direction — determined separately via the momentum histogram |
Even using the same Bollinger Bands, "has price touched the band" (Lesson 3) and "has the band's own width contracted" (Lesson 14) are entirely different questions. Where the breakout strategies covered earlier in this course focus on how to define a range, the squeeze uses how compressed that range has become as its entry timing signal — a fundamentally different lens.
Summary
- The TTM Squeeze overlays standard-deviation-based Bollinger Bands (inner) on ATR-based Keltner Channels (outer), flagging volatility compression whenever the Bollinger Bands sit fully inside the Keltner Channel (squeeze on).
- A squeeze only signals "a big move is more likely soon" — direction has to come from a separate momentum histogram (built via linear regression).
- The theoretical basis is volatility clustering (a statistical tendency) plus the market psychology that a tight balance doesn't hold forever — but there's no guarantee a move arrives within any set timeframe.
- False squeezes, timeframe dependence, and lag are real limitations, so it's standard to confirm with volume or another trend indicator rather than trading the squeeze alone.
- Unlike mean reversion ("has price touched the band") or breakout strategies ("has price cleared a defined range"), the squeeze treats band-width compression itself as the signal — a genuinely different lens from the rest of this course.