Trading Strategies · Lesson 43/57 · 9 min read
Head and Shoulders Pattern: Neckline Breaks, Price Targets, and How It Differs from a Double Top
In this article
- What a Head and Shoulders Pattern Actually Signals
- Anatomy of the Three Peaks
- Confirming the Neckline Break and Calculating a Target
- Inverse Head and Shoulders: The Mirror-Image Bottom Pattern
- Head and Shoulders vs. Double Top / Double Bottom
- A Practical Checklist: Entry, Stop, and Target
- FAQ
- Limitations and Caveats
- Summary
What a Head and Shoulders Pattern Actually Signals
The head and shoulders pattern has been a staple of technical analysis textbooks for close to a century, and it's still one of the most-searched chart patterns on any given day. The shape does exactly what the name suggests: three peaks in a row, with the middle one (the head) rising noticeably higher than the two on either side (the shoulders). It shows up most often near the tail end of an uptrend, right around the point where buying pressure has started to run out of gas.
The reason this shape keeps recurring is usually explained through a shift in participant psychology across the three peaks:
- Left shoulder: the uptrend is still intact, buyers push price to a new high, and trend-following demand is still flowing in normally.
- Head: after a pullback, price pushes to an even higher high, reinforcing the idea that the trend is alive and well. But this is often where some of the earlier buyers start locking in profits, and fresh buying tends to arrive with noticeably less force than before.
- Right shoulder: buyers make one more attempt at a new high, but this time price fails to clear the head's peak before rolling over. The failure to make a higher high is itself read as a sign that trend strength is fading.
The pattern isn't considered "confirmed" just because the third peak formed — it's only confirmed once price breaks down through the neckline, the support line connecting the two troughs between the peaks. Before that break, what looks like a head and shoulders in progress is often indistinguishable from an ordinary pullback.
Anatomy of the Three Peaks
Spotting a head and shoulders in real time, before the third peak is even finished, is a lot harder than picking one out on a chart after the fact. The table below lays out what each leg of the pattern typically looks like.
| Leg | Price behavior | Commonly cited volume tendency |
|---|---|---|
| Left shoulder | New high within an ongoing uptrend | Relatively strong |
| Head | New high above the left shoulder, after a pullback | Often somewhat lighter than the left shoulder |
| Right shoulder | Fails to clear the head, rolls over | Frequently the lightest of the three |
| Neckline break | Price closes below the support line joining the two troughs | Often picks back up on the break |
That "volume tends to fade as the peaks progress" observation traces back to classic technical analysis literature (Edwards and Magee is the usual reference point) and has been repeated widely ever since. It's worth being precise about what that is: a frequently cited tendency, not a statistically validated rule. Plenty of real head and shoulders patterns form with volume running in a different order, and volume alone was never meant to confirm or invalidate the pattern on its own.
The neckline also doesn't have to be perfectly horizontal. In practice, the two troughs rarely land at the exact same price, so the neckline is usually drawn as a diagonal line connecting them — sloping up or down slightly is completely normal.
Confirming the Neckline Break and Calculating a Target
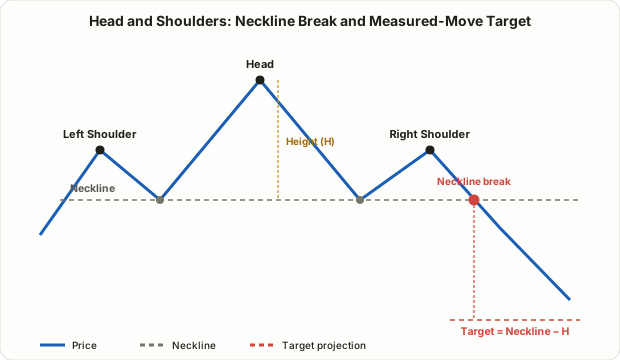
Spotting the shape isn't a signal to short on its own. A right shoulder that's still forming only makes this a candidate pattern — the common convention is to wait until price closes below the neckline before treating it as confirmed. A brief wick through the neckline that closes back above it (a "fakeout") is common enough that many traders specifically wait for a closing break rather than any intraday touch. The same support-turns-resistance logic from Lesson 4's Support, Resistance, and Breakout Trading applies directly here — once broken, the neckline often gets retested from below as resistance before price continues lower.
The price target comes from a simple geometric rule known as the measured move:
- Measure the vertical distance (height H) from the head's peak down to the neckline.
- Project that same distance H downward from the point where the neckline breaks.
- That projected level becomes the initial target.
Worked example: say a stock's head peaks at $68, with the neckline sitting at $60 — that's a height H of $8. Once price closes below $60, say at $59.70, the measured-move target is calculated from the neckline itself, not the exact breakdown print: $60 − $8 = $52.
⚠️ The measured-move target is a widely used rule of thumb, not a guarantee that price will reach it or stop precisely there. Plenty of head and shoulders patterns fall short of their target, and plenty overshoot it substantially. As covered in Lesson 6's Risk/Reward and Money Management, treat this number as a reference point for sizing your risk/reward, and manage the actual exit with a trailing stop or scaled-out approach rather than a single fixed target.
Inverse Head and Shoulders: The Mirror-Image Bottom Pattern
Flip the same logic upside down and you get the inverse head and shoulders, which shows up at the tail end of downtrends. Three troughs form in sequence — left shoulder, then a lower head, then a shallower right shoulder — and the pattern confirms once price closes above the neckline connecting the two peaks between them. The target math is identical, just projected upward: measure the head-to-neckline height H, then add it to the breakout point.
The psychology mirrors the topping version too: failing to make a new low on the right shoulder suggests selling pressure is running out. One practical wrinkle worth knowing — bottoming patterns often form messier and more volatile than topping patterns, since capitulation selling and short squeezes tend to whip price around more violently near lows than near highs.
Head and Shoulders vs. Double Top / Double Bottom
The pattern most often confused (or directly compared) with head and shoulders is the double top / double bottom. Both fall under the same broad category — a peak-or-trough shape signaling trend exhaustion — but the structural details differ in specific ways.
| Head and Shoulders | Double Top / Double Bottom | |
|---|---|---|
| Number of peaks (or troughs) | 3 (shoulder-head-shoulder) | 2 |
| Height relationship | The middle peak is clearly the highest (or lowest) | Both peaks (or troughs) sit at roughly the same level |
| Reference line | Neckline (connects the two troughs/peaks) | A middle support/resistance line playing the same role |
| Target calculation | Head-to-neckline height (H) projected from the break | Same geometric logic — peak-to-midline height projected from the break |
| Time to form | Generally longer (three peaks plus two troughs) | Generally shorter |
| Common confusion | An unclear right shoulder can look like a double top | A slightly higher second peak can look like a shoulder-head combo |
What's notable is that the underlying math for the price target — project the pattern's height from the breakout point — is identical for both. In practice, rather than forcing a chart into one label or the other, it's more useful to check two things: how many distinct peaks (or troughs) actually formed, and whether a clean horizontal or diagonal neckline can be drawn. When it's genuinely ambiguous, focus on the neckline break itself rather than which name the pattern deserves.
A Practical Checklist: Entry, Stop, and Target
Once a pattern is identified, these are the conventions most commonly referenced for actually trading it — again, widely used practices rather than fixed rules.
- Confirmation: require a closing break of the neckline, not just an intraday poke through it.
- Entry timing: some traders enter immediately on the break; others wait for a retest of the neckline before entering. Entering immediately captures more of the move toward the target, while waiting for a retest allows a tighter stop — at the cost of sometimes missing the trade entirely if price never comes back to retest.
- Stop-loss: for a head and shoulders, above the right shoulder's high; for an inverse head and shoulders, below the right shoulder's low. The logic is that a genuinely valid pattern shouldn't need price to trade back through that level.
- Volume confirmation: check whether volume picks up meaningfully on the neckline break relative to recent averages. A break on light volume is generally considered more prone to failing.
- Managing the target: rather than holding for the full measured-move target in one shot, it's common to scale out in pieces as price clears prior support/resistance levels along the way.
FAQ
What if the neckline is sloped instead of horizontal?
A sloped neckline doesn't invalidate the pattern — just draw the line connecting the two troughs (or peaks) as they actually are. The main practical issue is that a steep slope narrows the price range where a "break" is even meaningful, so the signal reads more cleanly when the neckline's slope is gentle.
Does the right shoulder need to match the left shoulder's height?
No, and in practice they're rarely a perfect match — asymmetry between the two shoulders is normal. The one condition that does matter is that neither shoulder clears the head's peak (or trough); if the right shoulder does clear it, you're likely looking at a different pattern entirely.
How reliable is the head and shoulders pattern in practice?
There's no officially validated, fixed win rate for this pattern — outcomes vary enormously depending on market conditions, timeframe, and exactly how strictly you define confirmation, so treat any specific success-rate percentage you see quoted online as unverified. Read it as one input suggesting the uptrend may be losing steam, not a standalone predictive tool, and always pair it with a defined stop-loss and independent risk management.
Limitations and Caveats
- Subjectivity: there's no universal rule for exactly which peak counts as a shoulder versus the head, so two traders can draw meaningfully different patterns on the same chart.
- Fakeouts (bull/bear traps): price briefly breaking the neckline and then snapping back into the prior trend is common. Entering on shape alone, without a closing confirmation or volume check, is how traders get caught in these traps.
- Hindsight bias: a textbook-perfect head and shoulders is easy to spot after the fact, but judging in real time whether a forming right shoulder is genuine — versus just another pullback inside a continuing uptrend — is a much harder call.
- Crowding risk: because this is such a widely known classic pattern, a large number of traders often cluster their stops around the same neckline and the same right-shoulder extreme, which can make that exact zone an attractive target for larger participants to sweep through.
Summary
- A head and shoulders pattern is a three-peak shape near the end of an uptrend — left shoulder, head, right shoulder — where the key condition is that the right shoulder fails to clear the head's high.
- The pattern confirms only once price closes below the neckline connecting the two troughs; the price target is the head-to-neckline height (H) projected downward from the break.
- Flip the logic upside down for the inverse head and shoulders, which signals a possible bottom at the end of a downtrend — same target math, opposite direction.
- The clearest distinction from a double top/bottom is the peak count (two versus three); the underlying target-projection math is identical for both patterns.
- Common practice is to enter on the break or after a retest, place a stop beyond the right shoulder's extreme, and treat the measured-move target as a reference rather than a guaranteed exit.
- This is an interpretive pattern with no validated success rate, real subjectivity, and meaningful fakeout risk — always pair it with volume confirmation and a defined stop-loss.