Trading Strategies · Lesson 45/57 · 9 min read
Seasonality Trading: Testing the September Effect, Santa Claus Rally, and 'Sell in May' with Real Data
In this article
- Why This Topic Right Now
- The September Effect: The Only Month With a Negative Average
- "Sell in May" (the Halloween Indicator): Splitting the Year in Two
- The Santa Claus Rally: A Very Narrow Seven-Day Window
- Comparing the Three Patterns
- A Worked Example of Applying This
- Why You Shouldn't Take These Numbers at Face Value
- FAQ
- Summary
Why This Topic Right Now
Every year around late August and early September, the same headline resurfaces: "September is historically the worst month for stocks." That's true right now, as this is being written in September, and Wall Street commentary is once again running the same playbook. This whole family of patterns falls under seasonality trading, sometimes called the calendar effect — adjusting position sizing based on the statistical tendency for returns to differ by month, day of week, or holiday window.
Almost everything else in this course — moving averages, ICT smart money concepts, order flow — analyzes price and volume data happening right now. Seasonality trading is different: it treats the date on the calendar itself as a variable. This lesson walks through the three most commonly cited calendar effects — the September Effect, "Sell in May" (the Halloween Indicator), and the Santa Claus Rally — with the actual statistics behind them, why these patterns might exist, and why treating them as fixed rules is a mistake.
The September Effect: The Only Month With a Negative Average
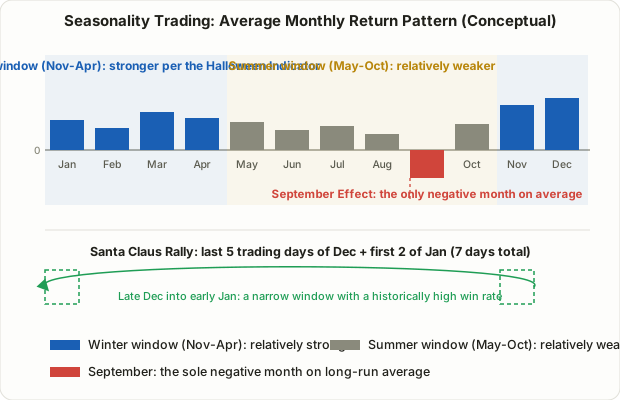
The most frequently cited calendar effect is the September Effect. Looking at S&P 500 monthly average returns going back to 1928, September is often reported as the only calendar month with a negative long-run average — commonly cited in the rough neighborhood of around -1% on average, though the exact figure shifts depending on the measurement window. September also tends to account for a disproportionate share of the worst individual monthly drawdowns in market history compared to other months.
Why September specifically? There's no single confirmed cause, but a few explanations get cited together:
- Post-summer rebalancing: Around the Labor Day holiday in the US, both institutional and retail investors tend to catch up on portfolio housekeeping they put off over summer.
- Mutual fund fiscal year-end: Many US mutual funds close their fiscal year in October, and September selling of underperforming holdings — similar in motive to tax-loss harvesting — is often cited as a contributing factor.
- Self-fulfilling expectation: The belief that "September is bad" can itself encourage some investors to sell preemptively, and that selling helps produce the very decline they expected.
It's more accurate to treat these as several contributing factors working together than as one confirmed cause.
"Sell in May" (the Halloween Indicator): Splitting the Year in Two
If the September Effect works on a one-month scale, "Sell in May and Go Away" splits the entire year in half. The rule is simple:
- Buy and hold starting November 1.
- Sell on May 1 and sit in cash or defensive assets over the summer.
- Re-enter in November.
Academics call this the Halloween Indicator, and early research covering data through 1998 found that in 36 of 37 countries studied, the November-through-April period produced statistically significantly higher returns than the May-through-October period. More recent work suggests that gap has narrowed compared to the earlier decades of data, though it hasn't disappeared entirely — looking only at the last few decades, the difference between the two windows tends to look smaller than the long-run historical average suggests. In other words, the pattern itself has been observed broadly and for a long time, but the size of the gap has clearly shifted across eras, and that nuance matters.
Explanations commonly offered for this pattern include:
- Seasonality in trading activity: Summer overlaps with vacation season for both institutions and retail traders, and trading volume and liquidity tend to thin out — and upward momentum can be harder to sustain in thin volume.
- Behavioral flows: New-year capital inflows and bonus-season reinvestment concentrated around year-end and early in the year are cited as making the winter window's demand relatively stronger.
The Santa Claus Rally: A Very Narrow Seven-Day Window
The third widely cited seasonal pattern is the Santa Claus Rally. First defined in the 1972 Stock Trader's Almanac, the definition itself is unusually specific:
The last 5 trading days of December plus the first 2 trading days of January — 7 trading days total.
Over that narrow window, the S&P 500 has averaged roughly a 1.3% gain since 1950, according to the Almanac's long-running data, and the market has closed higher during that window a notably high share of the time — commonly cited in the high-70% range. That's a meaningfully higher hit rate than a randomly chosen 7-trading-day stretch.
Explanations offered for the Santa Claus Rally include year-end bonus reinvestment, bargain-buying once tax-loss-driven selling wraps up for the year, and lower institutional trading volume around the holidays (meaning it takes less buying pressure to move prices up). Interestingly, the Stock Trader's Almanac itself pairs this pattern with a companion warning: "If Santa Claus should fail to call, bears may come to Broad and Wall" — treating a missing Santa rally not just as a missed seasonal bonus, but as a possible leading signal of market weakness ahead.
Comparing the Three Patterns
| September Effect | Sell in May (Halloween Indicator) | Santa Claus Rally | |
|---|---|---|---|
| Time window | 1 month (September) | Two 6-month windows (Nov-Apr vs. May-Oct) | 7 trading days (last 5 of Dec + first 2 of Jan) |
| Direction | Negative on average | Winter window stronger, summer window relatively weaker | Positive on average |
| Cited drivers | Post-vacation rebalancing, fund fiscal year-end, self-fulfilling expectation | Thinner summer volume, stronger winter inflows | Low year-end liquidity, bonus reinvestment, post-tax-loss-selling bargain buying |
| Practical use | Trim new buying, consider tightening hedges | Adjust exposure on a semiannual basis (position-sizing beats going fully to cash) | Reference point for short-term bullish baseline |
| Reliability concern | Only one observation per year — weak statistical power | Gap has narrowed in more recent decades | Window is so narrow that one or two exceptions swing the average heavily |
All three share the same core caveat: they're probabilistic tendencies, not guaranteed rules. It's also worth remembering that applying all three in the same year can sometimes produce conflicting signals rather than a clean, consistent playbook.
A Worked Example of Applying This
Here's a hypothetical of how an investor might fold seasonality into portfolio decisions. Say an investor normally runs an 80% equity allocation.
- Entering September: If the September Effect coincides with other independent evidence of short-term overheating (say, RSI above 70), the investor might pause new buying or trim exposure from 80% down to roughly 65-70%. But acting on the calendar alone — without confirming an actual trend break, the way Lesson 20 on Stan Weinstein's stage analysis teaches — isn't recommended.
- Re-entering in November: As the Halloween Indicator's favorable window opens in November, if other technical conditions also line up (for example, price reclaiming the 30-week moving average), the investor might raise exposure back to 80-90%.
- Late December into early January: During the Santa Claus Rally window, a reasonable use of the pattern is simply not rushing to sell existing positions — treating it as one supporting reason to stay the course, not a reason to add aggressively.
The key point is that seasonality alone should never be the sole basis for a buy or sell decision. In practice, it works best layered alongside the ATR/CMF risk filters from Lesson 13 or the risk-reward and money management principles from Lesson 6 — treated as a variable that tilts the odds slightly, not a standalone signal.
Why You Shouldn't Take These Numbers at Face Value
The most common mistake in seasonality trading is treating a historical average as a guaranteed future outcome. There are a few structural problems worth understanding.
The small-sample trap: The September Effect is observed exactly once per year. Even a century of data amounts to roughly 100 observations — not a statistically large number by any measure. The Santa Claus Rally's 7-trading-day window has an even smaller sample, meaning one or two unusual years can meaningfully shift the long-run average.
Data-mining bias in hindsight: Slice historical data across enough different time windows and combinations, and statistically interesting-looking patterns will turn up by chance. Whether "September is bad" reflects a genuinely structural, repeating phenomenon versus one month among twelve landing in negative territory by coincidence is genuinely hard to disentangle with full certainty.
Conditional exceptions, like midterm election years: Recent commentary has pointed out that September in US midterm election years has historically tended to perform better on average than September in other years. That alone shows that even a seemingly simple rule like "September is always bad" can be overturned once it collides with another variable, like the election cycle. Seasonality never operates in a vacuum — it's always intertwined with that year's macro backdrop, monetary policy, and valuation levels.
The "sold and missed the rally" risk: An investor who fully exits the market based on seasonality, only to watch that particular year rally hard against the seasonal pattern, pays a real opportunity cost. There are well-documented years where fully selling in May meant missing a strong rally over the following months — which is exactly why using seasonality as a basis for position-sizing, rather than an all-in/all-out binary decision, is the safer approach.
FAQ
Can I run a portfolio purely on seasonality?
Not recommended. Seasonality reflects a probabilistic tendency built on a small sample, with exceptions every year — it isn't a confirmed law. It's safer used as a supporting input alongside trend, volume, and valuation analysis rather than as a standalone strategy.
Does September mean I should automatically sell?
No. The September Effect is just a long-run average tendency, and plenty of individual Septembers have been strongly positive — especially in years, like US midterm election years, where other macro conditions overlap and shift the pattern. Selling based on the calendar alone, without other technical or fundamental confirmation, is an oversimplification.
Does this apply outside the US market?
Similar seasonal discussions exist in other markets, but sample periods are often shorter and market structure (foreign investor flows, dividend conventions, trading calendars) differs enough that US statistics shouldn't be applied directly. If you're trading a non-US market, it's worth checking that market's own long-run monthly data rather than assuming the same pattern transfers over.
Summary
- Seasonality trading (the calendar effect) adjusts position sizing based on the date itself rather than price or volume, and the September Effect, the Halloween Indicator ("Sell in May"), and the Santa Claus Rally are the three most widely cited examples.
- The September Effect refers to September's long-run average often being the only negative month; the Halloween Indicator splits the year into a stronger November-April window and a relatively weaker May-October window; the Santa Claus Rally refers to a narrow, historically strong 7-trading-day window spanning late December into early January.
- All three have plausible psychological and structural explanations — thinner summer liquidity, fund fiscal year-ends, tax-related selling, bonus reinvestment — but none is confirmed as a single, isolated cause.
- Because the sample sizes are small (once-a-year events) and conditional factors like midterm election years can flip the average, seasonality is safest used as a position-sizing input alongside other technical and fundamental analysis — never as a standalone all-in or all-out signal.
- "This has happened often in the past" and "this will happen again this year" are very different claims, and keeping that distinction in mind is the key to using seasonality trading responsibly rather than misusing it.