Trading Strategies · Lesson 46/57 · 10 min read
Harmonic Pattern Trading: Gartley, Bat, Butterfly & Crab Patterns and the PRZ
In this article
- What a Harmonic Pattern Actually Is
- The XABCD Skeleton: How to Read Any Harmonic Pattern
- Comparing the Four Core Patterns: Gartley, Bat, Butterfly, Crab
- Why the PRZ Is a Zone, Not a Single Price
- A Worked Example: Calculating a Bullish Gartley
- Managing the Trade: Entry, Stop, and Targets After the PRZ
- Harmonic Patterns vs. Elliott Wave: What's the Actual Difference
- Common Mistakes and Limitations
- FAQ
- Summary
What a Harmonic Pattern Actually Is
Lesson 30's Fibonacci Retracement & Extension makes the point that a level like 61.8% only matters because a critical mass of traders happens to be watching the same coordinate — not because of any physical law. Harmonic patterns take that idea one step further. Instead of relying on a single retracement level, a harmonic pattern requires five consecutive price points — labeled X, A, B, C, and D — to each satisfy a specific Fibonacci ratio relative to the others before the structure counts as valid at all.
The idea is older than it looks. H.M. Gartley first sketched a five-point reversal structure on page 222 of his 1935 book Profits in the Stock Market — which is why traders still sometimes call the base pattern "the 222." Decades later, analysts including Larry Pesavento and, most influentially, Scott Carney layered precise Fibonacci ratios onto that skeleton, producing the named variants traders use today: Gartley, Bat, Butterfly, and Crab. The term "harmonic trading" itself comes from Carney's framework, formalized in the 2000s.
The reason a harmonic pattern feels more convincing than a single Fibonacci level is straightforward probability: the odds of one ratio lining up by chance are much higher than the odds of four or five independent ratios converging at the same price by chance. When several separately-calculated levels stack up in one narrow zone, that's a stronger psychological case that the zone matters — and it's also a stronger case that other traders will be watching (and placing orders at) the same spot, which is what actually makes the level work. None of that amounts to a validated statistical edge; it's best understood as an extension of the confluence concept covered elsewhere in this course, not a guarantee.
The XABCD Skeleton: How to Read Any Harmonic Pattern
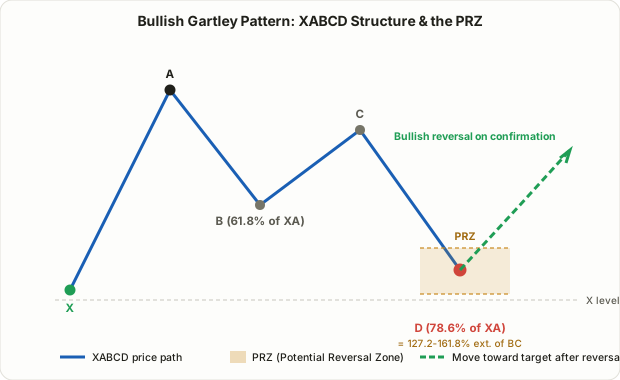
Every harmonic pattern shares the same underlying skeleton. Described for a bullish (reversal-to-the-upside) pattern:
- X → A: the first major swing. Every ratio in the pattern is measured against this leg.
- A → B: a retracement of the XA leg.
- B → C: a retracement of the AB leg — the range allowed here is wider across all four patterns.
- C → D: an extension (projection) of the BC leg. Point D is where the pattern completes and where a trade is considered.
- Point D (the PRZ): the zone where the XA retracement ratio and the BC extension ratio converge is called the Potential Reversal Zone (PRZ).
In a bullish version, X is a low, A is a swing high, B is a higher low than X, C is a lower high than A, and D comes back down near X (sometimes slightly above it, sometimes slightly below, depending on the pattern) — a zigzag that ends at the PRZ, where a long entry is anticipated. Flip the whole structure vertically and you get the bearish version, used for shorting a reversal at a swing high.
Comparing the Four Core Patterns: Gartley, Bat, Butterfly, Crab
All four patterns share the XABCD skeleton, but each requires different ratios at each leg. The table below reflects the ratios most commonly cited across harmonic-trading references — in practice, individual traders and scanning tools apply their own tolerance bands (typically ±3 to 5 percentage points), so treat these as conventional reference values rather than a rigid spec.
| Pattern | AB (of XA) | BC (of AB) | CD (of BC, extension) | D (of XA) |
|---|---|---|---|---|
| Gartley | 61.8% | 38.2%-88.6% | 127.2%-161.8% | 78.6% |
| Bat | 38.2%-50% | 38.2%-88.6% | 161.8%-261.8% | 88.6% |
| Butterfly | 78.6% | 38.2%-88.6% | 161.8%-224% | 127.2%-161.8% (beyond X) |
| Crab | 38.2%-61.8% | 38.2%-88.6% | 224%-361.8% | 161.8% (beyond X, deepest) |
The column worth studying is D. Gartley and Bat complete inside the XA range (78.6% and 88.6% retracement, respectively), while Butterfly and Crab push D past X entirely — into extension territory. That's why traders often group Gartley and Bat as "shallow retracement" patterns and Butterfly and Crab as "deep extension" patterns. The Crab's 161.8% extension of XA is the most extreme of the four, and it tends to show up after a market has run past its original swing into an exhaustion move that then snaps back hard.
A commonly used secondary check is the AB=CD pattern: if the CD leg's price length and duration (candle count) roughly match the AB leg, that adds another layer of confirmation for point D. AB=CD is a classic pattern in its own right, but inside harmonic trading it's most often used as a supplementary check layered on top of the XABCD ratios, not as a standalone signal.
Why the PRZ Is a Zone, Not a Single Price
Pinning point D to one exact price is unrealistic in practice. That's why harmonic traders define the PRZ as the range produced by however many ratios converge near D — the XA retracement, the BC extension, and, when relevant, the AB=CD projection. For a Gartley pattern, for example, the PRZ is the price band where the 78.6% retracement of XA and the 127.2%-161.8% extension of BC land close to each other.
The tighter that cluster of levels, the more confidence traders generally place in the zone; a "loose" PRZ, where the calculated levels are spread far apart, is typically treated as a weaker signal. That's a widely shared convention within the harmonic trading community, not a statistically validated probability — worth being explicit about before treating a tight PRZ as anything more than a modestly stronger setup.
A Worked Example: Calculating a Bullish Gartley
Suppose stock D prints the following swing:
- X = $30.00 (swing low)
- A = $50.00 (swing high; the XA move is $20.00)
- B = $37.64 (a 61.8% retracement of XA: $50.00 - $20.00 × 0.618 = $37.64)
- C = $45.00 (a partial retracement of AB, a bounce high)
Now calculate point D. For a Gartley, D sits at the 78.6% retracement of XA.
| Calculation | Formula | Value |
|---|---|---|
| XA range | $50.00 - $30.00 | $20.00 |
| D (78.6% retracement) | $50.00 - ($20.00 × 0.786) | $34.28 |
| BC range | $45.00 - $37.64 | $7.36 |
| CD extension at 127.2% | $45.00 - ($7.36 × 1.272) | $35.64 |
| CD extension at 161.8% | $45.00 - ($7.36 × 1.618) | $33.09 |
The 78.6% XA retracement ($34.28) and the 127.2%-161.8% BC extension ($35.64 to $33.09) overlap roughly between $33.00 and $35.60. That overlapping band is this Gartley's PRZ. A long entry is only considered once price actually enters that zone and prints a confirmation signal — a reversal candle (hammer, bullish engulfing) or a pickup in volume, for instance — not the instant it merely touches the range.
Managing the Trade: Entry, Stop, and Targets After the PRZ
Completing the pattern is not itself a signal to enter. The management rules most commonly cited in harmonic trading are:
- Entry: once price reaches the PRZ, wait for a confirmation signal — a reversal candle or a momentum divergence (RSI, for example) — before entering. Entering purely on a PRZ touch, with no confirmation, produces frequent stop-outs whenever the pattern simply fails.
- Stop-loss: for a bullish pattern, just below X — or, for the extension-type patterns (Butterfly, Crab) where D sits beyond X, just below D itself. If price pushes meaningfully past D and invalidates the structure, the pattern is considered failed.
- First target: commonly the 38.2% retracement of the CD leg.
- Second target: the 61.8% retracement of the CD leg, or the price level of point C, used as a secondary reference.
- Extended target: in a strong reversal, some traders leave the door open for price to retrace all the way back to point A as a final target.
As covered in Lesson 6's Risk/Reward & Position Sizing, computing the risk/reward ratio from entry to stop against the first and second targets before entering applies here without exception. However cleanly the ratios line up on a chart, skipping the stop-loss step turns a well-calculated PRZ into an ordinary unmanaged trade.
Harmonic Patterns vs. Elliott Wave: What's the Actual Difference
Both frameworks share the premise that price moves in recurring structure rather than pure randomness, but they approach that structure very differently.
| Harmonic Patterns | Lesson 34's Elliott Wave Theory | |
|---|---|---|
| Unit of analysis | A single five-point structure (X-A-B-C-D) | A continuous cycle of a 5-wave impulse and a 3-wave correction |
| What decides validity | Whether each leg's Fibonacci ratio falls inside a predefined range | Wave rules (e.g., wave 2 can't retrace past the start of wave 1) and overall wave shape |
| What it produces | A specific entry price, stop, and target set, anchored to the PRZ | An interpretation of which wave the market is currently in (a wave count) |
| Where subjectivity creeps in | The ratio math is mechanical, but choosing which swings count as X, A, B, C is a judgment call | The wave count itself is frequently disputed between traders looking at the same chart |
In practice, some traders combine the two rather than picking one: use Elliott Wave to judge the bigger picture — whether the market is currently in a corrective wave or an impulsive one — and then use a harmonic pattern inside that correction to pin down a specific entry and stop.
Common Mistakes and Limitations
- Ignoring how far off the ratios actually are. A scanning tool flagging "Gartley detected" doesn't mean the ratios are clean. The closer each leg sits to its textbook ratio (a "tight" pattern), the more weight traders generally give it.
- Entering the instant price touches the PRZ. The PRZ is a candidate reversal zone, not a buy or sell signal on its own. Skipping the confirmation candle or momentum divergence step produces avoidable stop-outs.
- Subjectivity in picking swing points. Where exactly X, A, B, and C get anchored changes every downstream ratio calculation. Two traders looking at the same chart can legitimately draw two different patterns.
- Noise on lower timeframes. On something like a 1-minute chart, XABCD-shaped structures appear constantly — but so does the chance that ordinary random price movement happens to line up with the required ratios, which degrades signal quality.
- No validated win-rate statistics exist. There's no authoritative study proving harmonic patterns succeed at any specific rate. Ratio convergence is a qualitative argument that a level is "probably not coincidental" — not a quantified guarantee of anything.
FAQ
What's the fastest way to tell a Gartley apart from a Bat pattern?
Check point D first. If D sits near the 78.6% retracement of XA, it's likely a Gartley; near 88.6%, likely a Bat. Cross-checking the B point retracement (around 61.8% for Gartley versus 38.2%-50% for Bat) makes the distinction clearer.
Why are Butterfly and Crab designed so that D pushes past point X?
That design exists specifically to capture extreme moves — cases where the market runs an exhaustion push past its original swing (XA) before snapping back. Because these extension-type patterns often mark a climactic move rather than an ordinary pullback, they tend to carry more volatility and require wider stops than Gartley or Bat.
Can I just trust an automated harmonic pattern scanner and trade off its alerts?
Scanners are generally reliable at the ratio math itself, but most don't filter for what happens after price reaches the PRZ — the reversal candle, the volume pickup, the momentum divergence. Treat a scanner as a tool for surfacing pattern candidates, and leave the entry decision to a human check of those confirmation signals.
Summary
- A harmonic pattern requires five points (X-A-B-C-D) to each satisfy a predefined Fibonacci ratio relationship — a stricter, more compound condition than a single retracement level.
- Gartley (D at 78.6% of XA) and Bat (D at 88.6% of XA) are shallow-retracement patterns; Butterfly and Crab, where D extends past X, are deep-extension patterns.
- The PRZ (Potential Reversal Zone) is the price band where the XA retracement and BC extension ratios converge — a tighter cluster of levels is conventionally read as a stronger signal.
- Enter on a confirmation signal inside the PRZ, not on the touch itself; place stops beyond X (or beyond D for extension-type patterns); use the 38.2% and 61.8% retracements of the CD leg as reference targets.
- Given the subjectivity in choosing swing points and the absence of validated win-rate data, always pair a harmonic setup with an explicit stop-loss rule.