Trading Strategies · Lesson 52/57 · 8 min read
Candlestick Pattern Trading: Morning Star, Three White Soldiers, and Volume Confirmation
In this article
Shapes Alone Aren't Enough
The candlestick basics lesson covered the shapes and meanings of doji, hammer, and engulfing patterns. The problem shows up the moment you try to trade them: buying every hammer you see, with no other filter, tends to produce a string of losses. A single candle's shape, by itself, gives you no way to tell a genuine shift in buying and selling pressure from ordinary noise.
This lesson covers two things the basics lesson didn't. First, three-candle patterns — morning star, evening star, three white soldiers, and three black crows — which show a more complete transition than a one- or two-candle signal can. Second, the specific confirmation checks — volume and location — that actually move the needle on reliability, for any candlestick pattern, not just the new ones introduced here. Candlestick patterns remain a staple of trading education worldwide, and they've drawn renewed attention recently as charting platforms roll out automated pattern-recognition tools.
Why Three Candles Beat One
A single candle captures one snapshot of a battle between buyers and sellers. The basics lesson already noted that a two-candle engulfing pattern is often considered more reliable than a single-candle signal, for exactly this reason — you're watching the shift in power play out across two points in time instead of one. A three-candle pattern extends that logic further: it shows the entire arc — sellers in control, a moment of balance, then buyers taking over (or vice versa) — more like a short video than a single photo.
Morning Star: Sunrise After a Selloff
This is the classic three-candle reversal at the end of a downtrend.
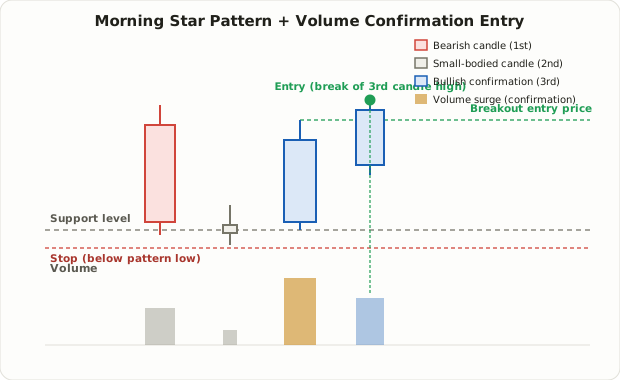
- First candle: a large bearish candle. Sellers are still firmly in control.
- Second candle: a small-bodied candle, often close to a doji, that gaps down and forms near the low of the first candle — a sign the fight has become a stalemate.
- Third candle: a large bullish candle that opens above the second candle and closes back above the midpoint of the first candle's body.
Read together, the three candles trace a clear psychological arc: strong selling, exhaustion, then a decisive shift to buying. The evening star is the mirror image — a bearish reversal at the top of an uptrend, tracing strong buying, exhaustion, then a decisive shift to selling.
Three White Soldiers vs. Three Black Crows
A different pair of three-candle patterns doesn't signal reversal so much as confirmation of the same direction, three times in a row.
- Three white soldiers: three consecutive long-bodied bullish candles, each opening within the prior candle's body and closing near its own high (short upper wicks). At the end of a downtrend, it's often read as a strong reversal signal; inside an existing uptrend, it's more often read as confirmation the trend is continuing.
- Three black crows: the mirror pattern — three consecutive long-bodied bearish candles, commonly read as a reversal signal at the top of an uptrend.
Both patterns share a practical drawback: by the time all three candles have printed, price has usually already moved a meaningful amount. Anyone entering only after full confirmation needs to factor that reduced reward-to-risk into the trade.
Two Confirmations That Actually Improve Reliability
Frequently cited pattern research (most notably Thomas Bulkowski's long-running pattern statistics site) has reported reversal success rates around 78% for morning star, roughly 72% for evening star, around 55–63% for engulfing patterns, and about 60% for hammers when a confirmation condition is added. These figures come from specific studies over specific stocks and time periods — they are reference points, not guaranteed probabilities that transfer to every market or every stock. What matters more than the exact percentage is the underlying principle: adding the two confirmations below reliably shifts the odds in a favorable direction, even if the exact magnitude varies.
Confirmation 1: Volume
The candle that completes the pattern — the third candle in a morning star, the engulfing candle in an engulfing pattern — should come with noticeably higher volume than usual. A reversal candle formed on thin volume may just reflect a handful of participants rather than a genuine change in who's in control. A clear volume spike, by contrast, suggests a larger group of market participants is actually repositioning.
Confirmation 2: Location (Support and Resistance)
The same morning star means something different depending on where it forms. One that appears at a well-defined support level, a prior swing low, or a major moving average — as covered in support and resistance breakout trading — carries more weight, because that's a price level many participants are already watching and may actively defend. A pattern that forms in the middle of a chart, with no structural significance nearby, is more likely to be coincidental noise.
Raw Pattern vs. Confirmed Pattern
The same shape gets handled very differently in practice depending on whether confirmation is present.
| Pattern Alone | Pattern + Volume + Location | |
|---|---|---|
| Signal frequency | Very high — appears somewhere almost daily | Meaningfully lower |
| False-signal rate | High | Lower |
| Entry basis | Shape of one candle formation | Shape + volume + support/resistance + next-candle follow-through |
| Practical use | Risky as a standalone trigger | Usable as an entry-timing filter within a broader strategy |
| Common mistake | Entering the instant the shape appears | Occasionally over-filtering and missing valid setups |
The trade-off is straightforward: each added confirmation reduces how often you get a signal but raises its average quality. Finding the right balance for your own trading style matters more than chasing either extreme.
A Worked Example
Suppose a stock completes a morning star near a long-term support level around $50. The first bearish candle's low is $49.00, the third bullish candle's high is $52.00, and volume on that third candle runs 2.3 times the 20-day average — a clear spike.
- Entry: buy once the candle after the pattern breaks above the third candle's high of $52.00 (waiting for the next candle's breakout, rather than acting on the pattern candle itself, is the generally recommended approach)
- Stop: just below the pattern's overall low, e.g., $48.75
- Initial target: derived from the prior swing high, or from the minimum reward-to-risk ratio discussed in risk-reward and money management (commonly 2:1)
Here, entry ($52.00) minus stop ($48.75) gives a risk of $3.25. Applying a 2:1 reward-to-risk ratio puts the target around $58.50. If there's a clear resistance zone in between — say heavy volume around $56 — it's more realistic to pull the target in front of that level instead, following the logic in Volume Profile and POC trading.
Common Mistakes to Avoid
- Jumping in before the pattern completes. Buying because the third candle of a morning star "looks like it's going to close bullish" exposes you fully to the risk that it closes some other way entirely.
- Crowding. Candlestick patterns have been taught for decades, and automated pattern-scanning tools have made them even more visible recently. When too many traders are watching the exact same signal at the same time, it can get faded or exhausted faster than it would in a less-crowded setup — worth keeping in mind rather than assuming a textbook pattern always plays out cleanly.
- Reversal patterns inside a strong trend tend to be weak. A reversal candle formation appearing in the middle of a powerful trend more often resolves as a brief pullback than an actual reversal. These patterns carry more weight after a trend has run long enough to show real signs of exhaustion.
- Reliability varies by timeframe. Short timeframes like 1-minute or 5-minute charts produce far more noise-driven patterns. Patterns on daily or weekly charts are generally treated as more significant.
FAQ
Can I trust the win-rate statistics for candlestick patterns?
Not as fixed probabilities. The figures cited above come from specific researchers studying specific stocks over specific periods — they're reference points, not universal constants. The safer takeaway is directional: a pattern backed by volume and location confirmation tends to be more reliable than the same pattern in isolation, not that any exact percentage will repeat.
Candle colors are reversed between platforms — how do I identify patterns reliably?
As covered in the candlestick basics lesson, many Korean platforms show up-candles in red while most U.S. platforms show them in green — the opposite convention. Judge patterns by the relationship between open and close (where the body sits) and candle sequence, not by color, so a platform switch never throws off your read.
Is a three-candle pattern more reliable than a two-candle engulfing pattern?
More candles generally mean a more thorough confirmation process, but there's no absolute hierarchy. Three-candle patterns take longer to complete, which means a later entry and often a price that has already moved further. Across any pattern, adding volume and location confirmation matters more than the raw candle count.
Summary
- Morning star and evening star trace a full three-candle arc from one side's control, through exhaustion, to the other side taking over — a more complete story than a single candle can tell.
- Three white soldiers and three black crows confirm the same directional pressure across three consecutive candles, read as reversal or continuation depending on where they appear.
- Reliability improves meaningfully when a pattern is backed by a volume spike and forms at a meaningful support or resistance level — commonly cited win rates should be treated as reference statistics, not guarantees.
- Enter on the breakout of the candle that follows the completed pattern, not the pattern candle itself, and place stops just outside the pattern's overall high or low.
- Because candlestick patterns are widely known, treat them as a timing filter layered on top of trend, volume, and structural context — not a standalone trading system.
Candlestick patterns sharpen entry timing, but they were never meant to be a complete trading system on their own. Reading the trend, the location, and the volume around a pattern matters far more than memorizing its shape.