Trading Strategies · Lesson 78/78 · 9 min read
Iceberg Orders vs. VWAP/TWAP Algos: Reading Institutional Footprints in the Tape
In this article
Why a Big Order Never Trades All at Once
Suppose a fund wants to buy 300,000 shares of a stock. If that order simply hits the book as a single 300,000-share bid, every other participant on the tape sees it instantly, front-runs it, and the price moves away before the fund gets filled — the fund ends up paying for its own order's market impact. Lesson 25's Dark Pool Prints covered one way institutions dodge this: trading off-exchange where the order never touches the public book at all. But plenty of volume still has to clear through the lit market, and that calls for a different fix — slicing the order into hundreds or thousands of small pieces and feeding them out over time according to a fixed rule. The programs that automate this are called execution algorithms, and the two most common are TWAP and VWAP. A third technique that gets confused with them constantly, but works on an entirely different principle, is the iceberg order.
This lesson is a different lens than Lesson 16's Order Flow Trading: Footprint Charts and CVD, which read buy/sell pressure inside individual candles. Here the signal lives in the rhythm of the tape (Time & Sales) over a much longer window — minutes to hours — and the goal is figuring out what kind of institutional order is actually running behind that rhythm.
How the Three Mechanisms Actually Work
Iceberg orders: hidden size that keeps refilling at one spot
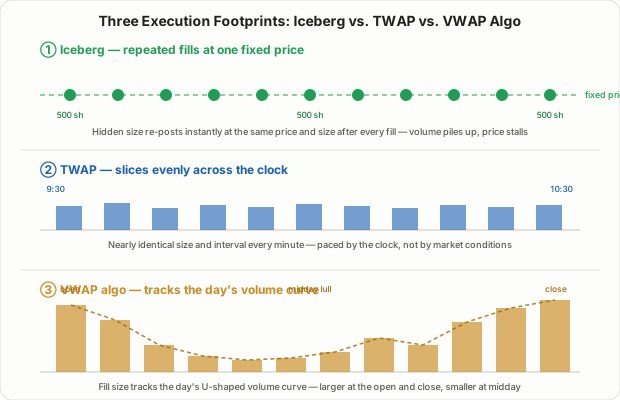
An iceberg order shows only a small slice of the total size on the book and keeps the rest hidden, automatically republishing the same visible size at the same price every time that slice gets filled. The name comes from the obvious metaphor — what you see above the surface is a tiny fraction of what's actually there. A real order for 100,000 shares might only ever show 500 shares on the book at a time; the instant that 500 fills, another 500 reappears at the exact same price.
TWAP: slicing by the clock
TWAP (Time-Weighted Average Price) slices an order on a time axis. Tasked with buying 100,000 shares over two hours, a basic TWAP schedule sends out roughly 833 shares every minute, at a near-constant pace regardless of what the market is doing around it. Fill speed stays roughly flat whether the tape is busy or dead quiet — that metronomic consistency is the signature.
VWAP algos: slicing by the volume curve
A VWAP algorithm shares TWAP's goal — getting filled at a decent average price without moving the market — but slices differently. It pushes more volume through during the parts of the day when the market itself typically trades more heavily (usually right after the open and right before the close) and throttles back during the slow midday lull, tracking the stock's typical intraday volume curve. The target is landing its own average fill price close to the market's actual VWAP for the day.
Telling Them Apart in the Tape
All three exist to move size without drawing attention, but each one leaves a genuinely different footprint in Time & Sales. The table below reflects heuristics traders commonly cite — not a statistically validated classification rule, so treat it as a starting framework rather than a hard test.
| Signal | Iceberg | TWAP | VWAP algo |
|---|---|---|---|
| Fill price | Almost always the same level | Drifts across a price range | Drifts across a price range |
| Fill timing | Irregular — refills the instant it's hit | Near-constant intervals | Intervals track volume |
| Fill size | Nearly identical (fixed display size) | Mostly uniform | Scales up during high-volume windows |
| Volume vs. price reaction | Volume piles up, price stalls (absorption) | Steady, gentle directional drift | Pace tracks the intraday volume curve |
| Typical timing | Clustered at one support/resistance level | Spread evenly across the execution window | Concentrated near the open and close |
The single most useful tell is a combination: volume spikes while price barely moves. Normally a big jump in volume should come with a proportional move in price. When volume keeps piling up at one level while price gets pinned to that same spot, it usually means a hidden order on the other side is absorbing every aggressive fill thrown at it. That absorption pattern is the core logic behind iceberg detection.
Looking at how regular the gaps between prints are helps separate TWAP from VWAP. TWAP ticks along almost like a metronome, while a VWAP algo's fill frequency and size shift noticeably by time of day. Clean round-lot fills — 100, 500, 1,000 shares repeating — are also commonly cited as a secondary tell that an algorithm, not a human clicking buttons, is behind the prints.
A Worked Example: Reading Three Cases Side by Side
Say a stock is trading on unusually heavy volume today, and ten minutes of Time & Sales shows the following.
Case A: 300-share fills print at $52.30 eleven times in a row. Almost nothing trades at any other price, and the offer just above $52.30 keeps getting hit — yet price never clears $52.40. Volume is piling up (3,300 shares) while price sits dead still. This reads as an iceberg bid absorbing sell pressure — someone is defending that exact level.
Case B: Between 9:30 and 10:30, fills of almost exactly 420 shares print every minute, with price drifting gently from $51.80 to $52.10 the whole time. The gaps between prints and their sizes barely vary. This looks like a TWAP buy program — the textbook signature of slicing by the clock rather than by volume.
Case C: Fill volume is heavy from 9:00-9:20 (roughly 80,000 shares in 20 minutes), drops off sharply from 11:00-1:00 (about 12,000 shares over two hours), then spikes again in the final 30 minutes before the close (roughly 60,000 shares). The shape of this activity tracks the stock's typical daily volume curve almost exactly. This is a classic VWAP algo footprint, pacing itself against the day's own volume shape.
All three cases share the same surface signal — "volume is unusually heavy today" — but the order behind each one is doing something completely different. The iceberg is defending a level, the TWAP is executing on a fixed clock regardless of conditions, and the VWAP algo is chasing the market's own average price.
Why the Distinction Actually Matters for a Trade
Separating these three isn't an academic exercise — each one carries a different implication for what happens next.
- If an iceberg is absorbing a level, that level can act as unusually firm support (or resistance) for as long as the hidden size holds out. It's genuinely hard to push through while that order remains. The catch is you have no way of knowing how much size is left behind it — once it's finally exhausted, price can snap through that level faster than it approached it.
- If a TWAP is steadily working one direction, expect a gentle but persistent directional push until the program's execution window closes. TWAPs almost always have a defined end point (the session close, or a fixed number of hours), so that pressure is not permanent.
- If a VWAP algo is tracking the volume curve, that's an execution objective, not a directional bet — the goal is landing close to the average, not pushing price anywhere. A VWAP algo's presence is better used the way Lesson 17's Anchored VWAP treats VWAP generally: as a reference for where the market's average price sits, not as a trend signal in its own right.
Limitations and Traps
This kind of analysis has real, structural limits worth stating plainly.
- Modern execution algorithms are already built to evade detection. Most institutional algorithms today deliberately randomize both fill size and timing specifically to avoid leaving the clean patterns described above. The cleaner the pattern, the more it's worth double-checking — and in heavily traded large-cap names, dozens of overlapping algorithms blur into noise that no simple heuristic can untangle.
- Confident classification needs Level 2 order-book data, not just the tape. The patterns in this lesson can be estimated from Time & Sales alone, but genuinely reliable detection needs real-time order-book depth alongside it. Candles and volume bars by themselves only get you an approximation.
- Coincidence is hard to rule out. Several unrelated retail orders landing close together, or two separate institutions independently trading the same direction at the same time, can produce a nearly identical-looking pattern. There's no way to say with certainty "this must be an algorithm."
- Easy to confuse with spoofing. Spoofing — illegally flashing orders with no intent to fill them, then cancelling — can superficially resemble an iceberg's footprint. The key difference is whether fills actually occur: an iceberg's visible size genuinely trades and then refills, while spoofing orders get pulled right before they would otherwise be hit.
- No verified performance statistics exist. There's essentially no independently verified, published backtest quantifying a specific win rate or return from trading off these footprints. The examples above illustrate the mechanics commonly cited in trading education, not a guaranteed edge.
FAQ
Can retail traders see these patterns in real time?
Some brokers and paid data vendors provide real-time Time & Sales and Level 2 (depth of market) data, and a growing number of charting tools now flag these patterns automatically. Free, standard retail charts generally don't carry this level of tape detail, which limits how precisely this can be done without a paid data feed.
Which of the three is the most reliable signal?
None of them is categorically better. An iceberg gives the clearest read on level defense but no visibility into how much size remains behind it. TWAP and VWAP carry weaker directional information on their own, but reveal fairly clearly that a systematic institutional program is actively working the stock right now. Any of these is best used to cross-check existing support/resistance or trend analysis, not as a standalone entry trigger.
Are iceberg orders illegal?
No. Iceberg orders (sometimes called "reserve orders" on certain exchanges) are an officially supported, fully legal order type on most major exchanges. They're a standard tool large traders use to reduce market impact, and they're categorically distinct from spoofing, which is illegal specifically because the displayed orders are never meant to be filled.
Summary
- Institutions can't dump a large order straight onto the book without moving the price against themselves, so they rely on execution algorithms that slice the order up — the three most common being iceberg orders, TWAP, and VWAP algorithms.
- An iceberg refills the same size at the same price repeatedly from hidden size; TWAP slices evenly across time regardless of conditions; a VWAP algo scales its pace to track the day's own volume curve.
- The clearest tell for an iceberg is an absorption pattern — volume piling up while price stalls — while the regularity of fill timing is what separates TWAP from VWAP.
- Each pattern carries a different implication: an iceberg signals level defense, a TWAP signals steady directional pressure with a defined end point, and a VWAP algo signals an execution objective closer to the market average rather than a directional bet.
- Modern algorithms are deliberately randomized to resist detection, confident classification needs Level 2 data beyond just the tape, and coincidence or spoofing can produce look-alike patterns — so treat this as a supporting signal, never a standalone reason to trade.