Trading Strategies · Lesson 48/57 · 10 min read
Market Structure Trading: BOS vs CHoCH Explained (Break of Structure & Change of Character)
In this article
- Why Market Structure Starts With Swing Highs and Lows
- BOS (Break of Structure): The Trend Is Still Alive
- CHoCH (Change of Character): The First Sign the Trend Might Be Turning
- BOS vs CHoCH at a Glance
- Internal vs. External Structure: Structure Depends on Timeframe
- A Worked Example With Numbers
- Trading It: BOS for Continuation, CHoCH for Risk Management
- FAQ
- Limitations and Caveats
- Summary
Why Market Structure Starts With Swing Highs and Lows
Lesson 39's ICT Order Blocks and Lesson 40's Supply & Demand Zones both name-dropped "break of structure" as a precondition — an order block only counts once a genuine structure break follows it. This lesson goes straight at that underlying concept: market structure, the foundational skeleton that everything else in smart money concepts (SMC) and ICT-style trading sits on top of. Order blocks, Fair Value Gaps, liquidity sweeps — all of them are interpreted through market structure, not the other way around.
Reading market structure doesn't start with an indicator. It starts with identifying swing highs and swing lows on a plain price chart. A swing high is a candle with lower highs on both sides of it; a swing low is a candle with higher lows on both sides. Once you can spot those, you label each new swing relative to the one before it, using four tags:
- HH (Higher High): a high that's above the prior high
- HL (Higher Low): a low that's above the prior low
- LH (Lower High): a high that's below the prior high
- LL (Lower Low): a low that's below the prior low
An uptrend is defined as a sequence that keeps printing HH and HL — both highs and lows climbing. A downtrend is the mirror image: LH and LL, both stepping down. Getting in the habit of tagging every swing point this way turns "is this still trending?" from a gut call into something you can actually check against a rule.
BOS (Break of Structure): The Trend Is Still Alive
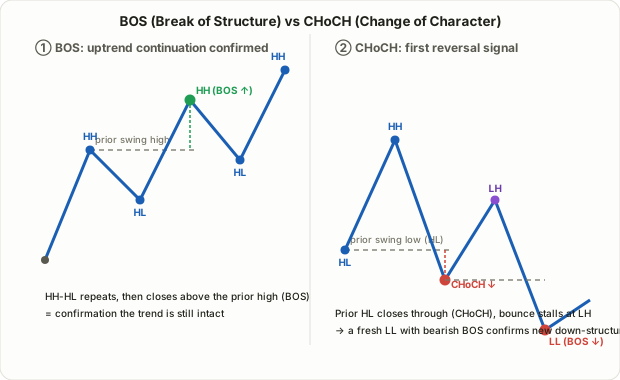
A break of structure (BOS) is a close-based break of the most recent swing point in the direction of the existing trend. In an uptrend, that means price closing decisively above the last swing high — a bullish BOS. In a downtrend, it means closing decisively below the last swing low — a bearish BOS.
A BOS isn't really "new information" so much as confirmation that a trend already in motion is still intact. Printing another HH in an uptrend means buying pressure has beaten selling pressure one more time, and as long as that pattern keeps repeating, it's the standard justification for holding a trend-following position or adding on a pullback. In short: BOS says "keep going the way you were already going."
CHoCH (Change of Character): The First Sign the Trend Might Be Turning
A change of character (CHoCH) is the opposite — a close-based break of the most recent swing point against the current trend. In an uptrend, that's the most recent HL (the last swing low) closing below itself — a bearish CHoCH. In a downtrend, it's the most recent LH (the last swing high) getting cleared — a bullish CHoCH.
BOS and CHoCH are really two names for the same kind of event, distinguished only by which side of the trend they break. Picture a clean uptrend printing HH-HL-HH-HL. The moment that last HL fails, it's simultaneously two things at once: from a bearish perspective, it's the opening move of a brand-new down-structure; from the uptrend's perspective, it's the first hard evidence the trend has cracked. That first break is the CHoCH. If the new downward sequence keeps going and later takes out the prior LL, that next break is labeled a BOS instead — because now it's confirming the new trend rather than breaking an old one. So the working relationship is: CHoCH is the first reversal signal, and BOS is the continuation confirmation that follows — whether that's confirming the reversal or confirming the trend that was already there.
⚠️ By the time a CHoCH prints, the move it's flagging has usually already happened to some degree. Confirming that a swing low actually broke requires waiting for price to trade back down and close through it — which makes CHoCH structurally a lagging confirmation signal, not a leading one. It's meant to be used with that lag in mind, not as a tool that calls the exact top or bottom.
BOS vs CHoCH at a Glance
| BOS (Break of Structure) | CHoCH (Change of Character) | |
|---|---|---|
| Direction | Same as the existing trend | Opposite to the existing trend |
| What it signals | Trend continuation confirmed | First sign of a potential reversal (or at least a pullback) |
| Swing point broken | Prior swing high (uptrend) / swing low (downtrend) | Prior swing low mid-uptrend / swing high mid-downtrend |
| Typical response | Hold or add to a trend-following position | Trim or tighten stops on the existing position; start watching the opposite side |
| Common companion | A natural extension after an earlier liquidity sweep | Often shows up right after a liquidity sweep (sweep → reversal → CHoCH) |
One thing that trips people up: CHoCH is, technically, also a "break of structure" in the literal sense of the words. The label alone doesn't tell them apart — the only thing that actually separates the two in practice is whether the break runs with the existing trend or against it.
Internal vs. External Structure: Structure Depends on Timeframe
The most common practical snag with market structure is deciding which swings actually count. A daily chart might show a clean, obvious uptrend, while the 1-hour chart inside that same stretch is full of small back-and-forth wiggles. The concept traders use to separate these two views is external structure versus internal structure.
- External structure is the dominant trend drawn from the higher timeframe (or the larger swing range) — only the biggest, most significant swing highs and lows survive.
- Internal structure is the smaller set of swings that forms inside one leg of that bigger structure — the micro-movements within a pullback or consolidation.
The two sit in a hierarchy. If external structure is bullish, a small internal CHoCH is usually read as nothing more than a pullback — noise inside a healthy trend — not a reversal. Only when the external structure itself breaks with a CHoCH does that get treated as a genuine trend change. The common approach, then, is not to flip direction the moment an internal CHoCH shows up, but to use internal structure — in the same direction as external structure — purely to time entries. For example: if the daily chart (external structure) is still bullish and the 1-hour chart (internal structure) prints a bearish CHoCH, many traders read that not as "the trend is over" but as "a pullback may be setting up a buying opportunity."
A Worked Example With Numbers
This is easier to follow with an actual price sequence. Say a stock moves like this:
- $100 (swing low) → $120 (swing high) → $108 (swing low, above the prior low of $100 → HL)
- Bounces off $108 and closes above $128 (clears the prior swing high of $120 → bullish BOS, a new HH forms)
- Pulls back and closes below $106 (breaks the prior swing low of $108 → bearish CHoCH, the first crack in the uptrend)
- Bounces briefly but stalls at $118 (below the prior high of $128 → an LH)
- Rolls over and closes below $98 (breaks the prior swing low of $106 → bearish BOS, a new LL confirms the new downtrend)
Step 3's CHoCH was a warning that the trend might be turning — it did not, by itself, confirm a downtrend. Confirmation only arrived at step 5, when a genuine LL printed with a bearish BOS behind it. That's the standard sequencing in practice: rather than dumping a position or flipping short on the CHoCH alone, most traders wait to see whether the following bounce fails below the prior high (as it did at $118 in step 4) and whether a fresh LL actually follows.
Trading It: BOS for Continuation, CHoCH for Risk Management
The two signals tend to play different roles for a trader.
- Using BOS: if you're already in a trend-following position, a BOS is a reason to hold it. If you're not yet in, a BOS gives you grounds to enter on the pullback that follows, in the same direction. This is the same underlying logic as Lesson 9's Trend Pullback Re-Entry With Moving Averages — confirm the trend first, then re-enter on the retracement. Stops typically sit just beyond the swing point that produced the BOS, or just past the prior HL (in an uptrend) / LH (in a downtrend).
- Using CHoCH: rather than treating a CHoCH as an immediate buy or sell trigger on its own, most traders use it first as a cue to re-check the risk on an existing position — trimming a long, or tightening a stop, the moment a bearish CHoCH prints against it. For a fresh position in the new direction, the more conservative approach waits for confluence — an order block from Lesson 39, or a liquidity sweep from Lesson 5 — sitting at that same level, plus confirmation that the next bounce fails to clear the prior high (forming an LH) before actually entering.
FAQ
Is it fine to just use an indicator that auto-labels BOS and CHoCH?
TradingView and similar platforms have plenty of community indicators that detect swing points automatically and stamp BOS/CHoCH labels on the chart. The catch is that how many bars an indicator uses to define a "swing" (its sensitivity setting) changes where those labels land — two different indicators can label the same chart differently. Using one is fine, but it's worth practicing spotting swing highs and lows by eye too, so you understand what the indicator's setting is actually doing.
Does a CHoCH always mean the trend has reversed?
No. A CHoCH is only the first sign that a reversal is possible — it isn't a confirmed reversal by itself. If price, after a CHoCH, goes on to print a fresh extreme in the original trend direction (a new HH, if it was an uptrend), the CHoCH turns out to have just been a deeper-than-usual pullback, not a real reversal. As the worked example above shows, the real confirmation is whether an LH and then an LL actually follow.
How do I separate an internal CHoCH from an external one?
There's no universal rule, but a common convention is to draw external structure from a higher timeframe (daily, 4-hour) and internal structure from a lower one (1-hour, 15-minute) on the same instrument. Because a break in external structure is the far more consequential signal, the practical habit is to treat frequent internal CHoCHs as background noise and reserve real reactions for when the external structure itself breaks.
Limitations and Caveats
- Subjectivity and hindsight bias: which candles qualify as a swing high or low depends heavily on the timeframe and sensitivity you're using. Structure looks obvious in hindsight on a chart that's already played out; in real time, plenty of swings are genuinely ambiguous until they're confirmed.
- Lag: as noted above, both BOS and CHoCH only confirm after a swing point has formed and been broken on a closing basis. Neither one is built to catch the exact top or bottom of a move.
- Whipsaw in choppy conditions: in low-volatility, range-bound markets especially, internal-structure CHoCHs can fire repeatedly in quick succession. Trading every one of them tends to produce a string of small stop-outs. Anchoring decisions to external structure is the practical way to cut that noise down.
- An unvalidated framework: as flagged in Lesson 39, market structure labeling — like much of ICT/SMC methodology — isn't a formally validated academic framework. Define your swing-point rules precisely, backtest them on real historical data, and only then bring them into live trading.
Summary
- Market structure starts by labeling swing highs and lows as HH, HL, LH, or LL; a repeating HH/HL sequence defines an uptrend, and a repeating LH/LL sequence defines a downtrend.
- BOS (break of structure) is a close-based break of the prior swing point in the same direction as the existing trend — confirmation that the trend is continuing.
- CHoCH (change of character) is a close-based break of the prior swing point against the existing trend — the first sign a reversal may be forming, though it doesn't confirm one by itself.
- Separating external structure (the higher-timeframe big picture) from internal structure (the smaller swings inside it) lets you treat frequent internal CHoCHs as pullbacks and reserve real trend-change conclusions for breaks in external structure.
- BOS is commonly used to hold or enter trend-following positions, while CHoCH is more often used first as a risk-management trigger on existing positions — with fresh counter-trend entries reserved for cases where an LH/LL sequence and other confluence follow the CHoCH.
- Both signals are lagging, close-confirmed events built on an unvalidated interpretive framework, so pair them with independent stop-loss and risk-management rules rather than trading them in isolation.