Trading Strategies · Lesson 50/57 · 11 min read
SMT Divergence Trading: Spotting Fake Breakouts With Correlated Assets Like ES/NQ
In this article
- What SMT Divergence Is — and Why You'd Look at Two Charts at Once
- Why This Is Supposed to Work: Liquidity Sweeps and Arbitrage Pressure
- Bullish vs. Bearish SMT Divergence
- Picking a Pair: Correlation Comes First
- A Practical Workflow
- A Worked Numerical Example
- SMT Divergence vs. Traditional Indicator Divergence (RSI/MACD)
- SMT Divergence vs. Pairs Trading (Statistical Arbitrage)
- FAQ
- Limitations and Caveats
- Summary
What SMT Divergence Is — and Why You'd Look at Two Charts at Once
Lesson 5's ICT Smart Money Basics covered liquidity and sweeps, and Lesson 48's Market Structure: BOS vs CHoCH covered how to read structure breaks on a single chart. Both of those tools share one blind spot: neither one, by itself, tells you whether a fresh high or low you're looking at is the start of a real continuation or just a sweep of resting liquidity that's about to snap back.
SMT divergence (Smart Money Technique Divergence) is an attempt to close that gap by putting two assets that normally move together side by side and watching for the moment they stop agreeing. The term comes out of the ICT (Inner Circle Trader) community, but the mechanic underneath it is simple. Take two instruments with a historically strong correlation — S&P 500 futures (ES) and Nasdaq-100 futures (NQ), or EURUSD and GBPUSD — and under normal conditions they tend to print new highs and lows at roughly the same time, because they're both reacting to the same macro forces (rates, dollar strength, risk appetite). SMT divergence is the moment one instrument makes a new extreme while the other fails to confirm it — that failure-to-confirm is the signal.
Why This Is Supposed to Work: Liquidity Sweeps and Arbitrage Pressure
Two mechanisms get cited most often for why this divergence matters.
First, a genuinely broad move should show up across correlated assets, not just one. ES and NQ share a large chunk of overlapping large-cap exposure, and a meaningful share of institutional flow trades both indices together for hedging and arbitrage. If buying or selling pressure had genuinely shifted market-wide, there's little reason it would show up in ES and simply not appear at all in NQ. When only one instrument prints the new high, the more likely explanation is that the move was a localized event — stop orders and resting liquidity sitting in that one contract getting run, rather than the whole market repricing. In that framing, SMT divergence works as a filter that separates "broad buying/selling" from "a sweep aimed at one asset's liquidity pool."
Second, arbitrage pressure is cited as a force that can pull the divergence back together. When correlation between two normally tight instruments stretches unusually far, arbitrage desks running spread trades — the same underlying logic covered in Lesson 18's Pairs Trading & Statistical Arbitrage — have an incentive to sell the stretched instrument and buy the lagging one, nudging the gap back closed. This is commonly offered as part of why divergences tend to resolve rather than persist indefinitely. Both explanations, to be clear, are conventional trading-desk reasoning rather than mechanisms with formal academic backing — treat them as plausible logic, not proven causation.
Bullish vs. Bearish SMT Divergence
SMT divergence comes in two directions:
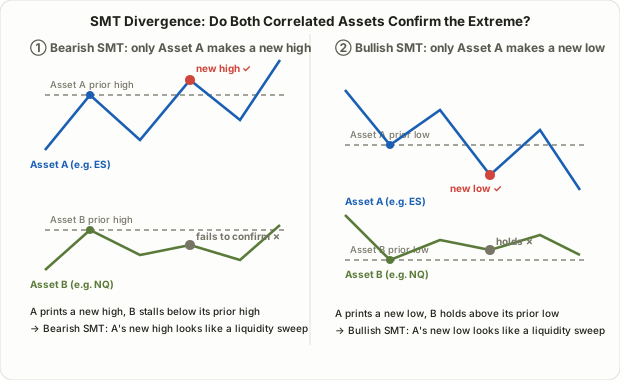
- Bearish SMT divergence: Asset A prints a higher high above its prior swing high, while Asset B, at the same moment, fails to clear its own prior high and prints a lower high instead. Asset A's new high looks less like broad buying and more like a localized liquidity sweep — a candidate for a reversal lower.
- Bullish SMT divergence: Asset A prints a lower low below its prior swing low, while Asset B holds above its own prior low, printing a higher low instead. Asset A's new low looks like a localized sweep rather than broad selling — a candidate for a reversal higher.
The core question is always the same: within the same swing cycle, did one asset make a new extreme while the other didn't? When both assets confirm each other by making new highs (or lows) together, that's not divergence — it's actually a broader confirmation that the move is real.
Picking a Pair: Correlation Comes First
SMT divergence isn't something you can bolt onto any two random tickers. The whole premise depends on the two assets normally moving together — without that, "divergence" is a meaningless label. Commonly used pairs include:
| Asset class | Typical pair | Why they're correlated |
|---|---|---|
| US index futures | ES (S&P 500) ↔ NQ (Nasdaq-100), YM (Dow) | Heavy overlap in large-cap holdings; both react to the same rate/dollar macro drivers |
| FX majors | EURUSD ↔ GBPUSD | Both move inversely with broad dollar strength/weakness |
| Metals | Gold ↔ Silver | Share the same safe-haven and inflation-hedge demand |
| Domestic indices | KOSPI 200 futures ↔ KOSDAQ 150 futures | Both react to domestic risk appetite and foreign flows, though divergences are more frequent given the large-cap/small-cap split |
There's no formally validated cutoff, but a commonly cited rule of thumb is to favor pairs whose recent daily-return correlation sits somewhere around 0.7 or higher. Treat that as a convenience threshold, not a validated statistic — correlation shifts with market regime, so it's worth rechecking periodically rather than assuming a pair that worked last quarter still qualifies today.
A Practical Workflow
Rather than trading SMT divergence in isolation, the common approach layers it with other structural confirmation:
- Mark the zone: On a higher timeframe, flag an obvious swing high or low that both assets are approaching together — a level where liquidity is likely resting.
- Watch for the split: As price reaches that zone, compare in real time whether one asset closes (or trades) beyond that swing point while the other stalls short of it.
- Confirm structure on the weaker asset: Check whether the asset that failed to confirm the new extreme then prints its own CHoCH (Change of Character, from Lesson 48) — most traders treat the divergence alone as insufficient and wait for this second, asset-specific confirmation before acting.
- Entry and stop: Traders differ on whether they trade the "strong" instrument that made the extreme or the "weak" one that diverged, but a common approach is entering in the reversal direction on the weak asset's CHoCH, with a stop just beyond the swing point that was just swept.
- Target: The next resting liquidity pool on the opposite side — typically the prior swing point, or a zone that lines up with an ICT Order Block from Lesson 39 — often serves as the first profit target.
A Worked Numerical Example
Say ES (S&P 500 futures) and NQ (Nasdaq-100 futures) trade like this:
- 9:30 AM: both instruments are climbing. ES prints a prior swing high at 5,820, NQ prints one at 20,450.
- 10:15 AM: a headline pushes ES up to 5,838, closing above its prior high of 5,820 — on its own, that reads as continuation.
- At the same moment, NQ only reaches 20,410 and fails to clear its prior high of 20,450 before rolling over — bearish SMT divergence: ES confirms a new high, NQ doesn't.
- 10:22 AM: NQ's own chart breaks its prior swing low of 20,300 on a closing basis — a bearish CHoCH.
- A trader shorts NQ at that point, with a stop just above the fresh swing high at 20,410 and a target near the prior swing low zone around 20,180 (the next resting liquidity pool).
- 11:05 AM: ES also fails to hold 5,838 and pulls back to 5,795 — both indices reverse lower, confirming after the fact that the earlier ES high was the "fake breakout" the divergence had flagged.
This is a constructed illustration, not a historical trade. In real markets, divergence doesn't always resolve this quickly — both assets can keep grinding to new highs together for a while after a divergence first appears. Treat SMT divergence as one piece of confluence that tilts the odds slightly, not a confirmed reversal signal on its own.
SMT Divergence vs. Traditional Indicator Divergence (RSI/MACD)
Lesson 47's MACD Signal & Divergence covers RSI and MACD divergence, which shares a name with this lesson's topic but compares entirely different things. Worth laying out side by side:
| SMT divergence | RSI/MACD divergence | |
|---|---|---|
| What's compared | Two separate, correlated assets (e.g., ES vs NQ) | One asset's price vs. its own indicator |
| What it flags | Whether a new extreme reflects broad market force or a localized liquidity sweep | Whether the momentum behind a move is fading |
| Data required | A second chart with a validated correlation | Just the one asset's price and indicator |
| Typical use case | Confirming liquidity sweeps and structure shifts within an ICT/SMC framework | Warning of fading momentum in trend-following or mean-reversion strategies |
| Timing | Lagging — both assets' extremes have to be confirmed first | Also lagging, for the same reason (indicator calculation trails price) |
The two can stack. If NQ shows SMT divergence at the same swing point where its RSI also shows bearish divergence, that's two independently derived signals pointing at the same underlying conclusion — fading momentum — which adds a layer of confluence rather than duplicating the same information.
SMT Divergence vs. Pairs Trading (Statistical Arbitrage)
Lesson 18's Pairs Trading also looks at two correlated assets together, which makes it easy to conflate with SMT divergence on the surface — but the goal and the trade structure are fundamentally different.
| SMT divergence | Pairs trading (statistical arbitrage) | |
|---|---|---|
| What gets traded | One asset — the one showing the divergence — traded directionally | Both assets simultaneously, long one and short the other, trading the spread itself |
| Basis for the signal | Structural: did a swing point get confirmed or not | Statistical: a computed spread deviation, typically a z-score |
| Market exposure | Directional bet — betting the market moves one way | Designed to be market-neutral — betting the spread converges regardless of direction |
| Typical holding period | Minutes to hours — scalping or day trading | Swing to medium-term |
In short, SMT divergence is a tool for timing a directional trade on one asset by cross-checking it against another, while pairs trading treats the relationship between the two assets as the actual position. They both start from correlation, but they end up doing very different jobs.
FAQ
Can SMT divergence be applied to any two tickers?
It's not recommended. The whole premise rests on the pair normally moving together. Forcing the concept onto two loosely or inconsistently correlated names produces so many "divergences" that the signal stops meaning anything. Check the recent correlation first, and stand down on SMT judgments during periods when correlation itself has clearly broken down — for example, when one of the two assets is reacting to news specific to it alone.
Is it safe to enter a trade on SMT divergence by itself?
Not as a conservative approach. SMT divergence only supplies context — "this extreme looks suspicious" — rather than a trigger. The more common workflow waits for additional confirmation on the diverging asset itself, such as a CHoCH or a reaction at an order block, before actually entering.
What timeframe should I use?
There's no fixed rule. Divergence on a higher timeframe (4-hour, daily) is often treated as a signal of a larger reversal, while divergence on lower timeframes (1-minute to 15-minute) is typically used for shorter scalping setups. The tradeoff is that lower timeframes also generate far more noise — coincidental mismatches that aren't really SMT signals at all.
Limitations and Caveats
- Correlation isn't fixed. The relationship between any two assets strengthens and weakens with market conditions, and asset-specific news (an earnings report, a policy announcement) can break the correlation entirely for a stretch. A "divergence" that shows up during one of these periods may just be correlation breakdown, not a genuine SMT signal.
- Subjectivity: there's no universally agreed standard for which swing points to compare or which timeframe to use, so two traders can read the same pair of charts differently.
- An unvalidated framework: as noted in Lessons 5, 39, and 48, SMT divergence — like most of ICT/SMC methodology — hasn't been formally validated as a statistically proven edge in academic research. Track how often it occurs and what happens afterward on your own historical data, on the specific pairs and timeframes you actually plan to trade, before relying on it live.
- Not a standalone signal: as emphasized throughout this lesson, SMT divergence is a confluence tool that adds value alongside other structural confirmation — CHoCH, order blocks, the location of resting liquidity. Sizing up a position on the divergence alone isn't advisable.
Summary
- SMT divergence occurs when, of two normally correlated assets, only one prints a new swing high or low while the other fails to confirm it — bearish when it happens at a high, bullish when it happens at a low.
- The reasoning behind it rests on two ideas: a genuinely broad market move should show up across correlated assets, and arbitrage pressure tends to pull extreme divergences back together — both are conventional trading-desk logic, not formally proven causation.
- Using it requires picking a pair with strong, currently-valid correlation (ES/NQ, EURUSD/GBPUSD, and similar), and standing down when correlation itself looks broken.
- The more conservative approach doesn't trade the divergence alone — it waits for the diverging asset to confirm its own reversal with a CHoCH or similar structural signal before entering.
- RSI/MACD divergence compares one asset's price against its own indicator, while SMT divergence compares two separate assets; pairs trading looks at a similar setup but trades the spread itself rather than betting on direction.
- Given correlation breakdown risk, subjective judgment calls, and the lack of formal academic validation, SMT divergence should always be paired with independent confirmation and a firm stop-loss rule.