Trading Strategies · Lesson 49/57 · 11 min read
Cup and Handle Pattern: Pivot Point Entries, Price Targets, and How It Differs from VCP
In this article
- What a Cup and Handle Pattern Signals
- Cup Shape: Why a Rounded "U" Is Preferred Over a Sharp "V"
- The Handle and the Pivot Point: Where Entries Actually Happen
- Calculating a Price Target (Measured Move)
- Where to Place a Stop
- Cup and Handle vs. VCP: What's Actually Different
- FAQ
- Limitations and Caveats
- Summary
What a Cup and Handle Pattern Signals
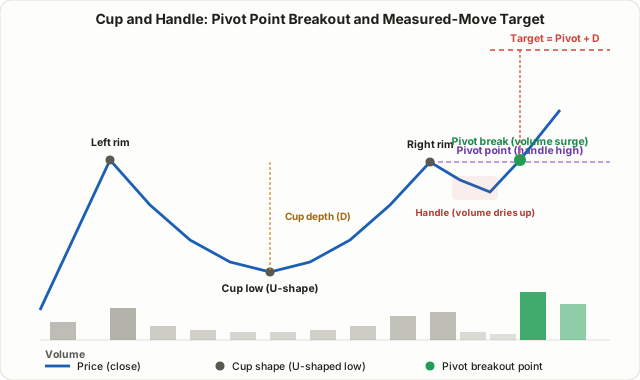
William O'Neil popularized the cup and handle pattern in his 1988 book How to Make Money in Stocks, and decades later it's still one of the most commonly referenced setups in growth-stock swing trading. The shape matches its name: a rounded, U-shaped base (the cup) forms first, followed by a short, mild pullback near the highs (the handle), and the pattern completes when price breaks above the handle's high. Unlike a head and shoulders or a double top, this is not a pattern that marks the end of a trend — it's a continuation pattern, signaling a pause inside an existing uptrend rather than its reversal.
The recurring shape has a fairly intuitive psychological explanation:
- Left side of the cup: a stock that has already run up meaningfully starts pulling back as early buyers take profit.
- Bottom of the cup: as the pullback deepens, stop-losses and disappointed sellers keep hitting the market, but at some point selling pressure visibly slows — often alongside declining volume — as if most of the willing sellers have already sold.
- Right side of the cup: buyers gradually step back in and price climbs back toward the old high. This leg is often choppy rather than smooth, since traders who bought near the old top are frequently looking to exit "near breakeven," creating a mild overhead supply.
- Handle: a second, shallower pullback forms near the right side of the cup. Unlike the cup low, volume here often dries up noticeably — read as a sign that aggressive sellers are largely exhausted. Once the last of the weak holders are shaken out during the handle, a break above the handle's high completes the pattern.
Cup Shape: Why a Rounded "U" Is Preferred Over a Sharp "V"
The table below summarizes the conditions most commonly cited for a valid cup, drawn from O'Neil's original methodology and the Investor's Business Daily (IBD) tradition that followed it. These are widely repeated rules of thumb, not statistically validated laws.
| Element | Commonly cited guideline |
|---|---|
| Prior uptrend before the cup | At least a 30%+ advance leading into the cup is generally seen as adding credibility |
| Cup depth | Roughly 12–33% off the high is the typical range; depths approaching 50% are sometimes mentioned in volatile markets but are considered lower quality |
| Formation time | Anywhere from about 7 weeks to several months (commonly 3–6 months) |
| Bottom shape | A gradually rounding U-shape is preferred; a sharp V-shape (fast drop, fast snap-back) is generally viewed as lower quality |
| Right-side high | Ideally recovers close to the left side's high, though somewhat lower is often considered acceptable |
| Volume near the low | Frequently observed to shrink as the decline slows |
The reasoning behind preferring a U over a V is fairly mechanical. A sharp, fast decline followed by an equally fast snap-back doesn't give the market much time to actually absorb supply — price recovers, but the overhang of trapped buyers from the old high is still sitting there, ready to sell into the first rally. A rounded base, by contrast, gives buyers and sellers more time to transact at successively higher prices, which is read as a sign that supply has been more thoroughly absorbed. That said, this is an interpretation, not a guarantee — plenty of V-shaped recoveries work out fine, and plenty of textbook U-shapes fail.
The Handle and the Pivot Point: Where Entries Actually Happen
The handle is where most cup and handle setups either confirm or fall apart. Skip it, or let it run too deep, and the pattern's reliability is generally considered to drop sharply.
- Location: the handle should ideally form in the upper half of the cup, and preferably within the top third. If the handle's low slips below the 50% retracement level of the entire cup, many traders no longer treat it as a healthy pause — it starts to look like a continuation of the downtrend instead.
- Depth: O'Neil's original guideline, still widely quoted, caps the handle's pullback at roughly 8–12% off the right side's high. Treat this as a commonly used ceiling rather than a hard, universal cutoff.
- Duration: typically at least one to two weeks, often running several weeks. A handle that resolves in a day or two is generally seen as not having done enough work absorbing supply, while one that drags on far longer than the cup itself is often considered to have invalidated the pattern.
- Volume: a noticeable dry-up in volume during the handle is a frequently cited tell, interpreted as selling pressure running out.
- Shape: a mild downward-sloping channel or a tight, narrowing triangle is common; some handles resemble a small flag.
The pivot point is the handle's high — the price level that, once cleared, counts as the breakout. O'Neil's CANSLIM methodology popularized the idea of a "buy zone" running from the pivot point up to about 5% above it, the logic being that buying too far past the pivot — say, 10–15% above it — erodes the reward relative to a reasonable stop, worsening the risk/reward on the trade.
Volume confirmation matters here as much as it does for the breakout itself. A commonly cited condition in CANSLIM-style methodology is that volume on the pivot break should run noticeably above average (often measured against the 50-day average). A break on light volume is generally treated as more likely to fail, since it suggests real demand hasn't shown up yet. Reading this alongside Lesson 41's CANSLIM Growth Stock Strategy — which covers volume and institutional sponsorship in more depth — gives a fuller picture of whether a given breakout has real backing.
Calculating a Price Target (Measured Move)
The cup and handle's price target follows the same measured move logic used for a head and shoulders, just projected in the opposite direction — upward instead of downward.
- Measure the vertical distance from the cup's left-side high down to the cup's low. Call this the cup depth (D).
- Project that same distance D upward from the pivot point (the handle's high).
- That projected level becomes the initial target.
Worked example: say a stock starts its run at $40, rallies to $60 at the left rim of the cup, then pulls back to $48 at the cup's low. The cup depth D is $60 − $48 = $12. Price then recovers to $59 on the right side, drifts down to $56.50 during the handle, and finally breaks above the $59 pivot on a volume surge. The measured-move target is calculated as $59 (pivot) + $12 (D) = $71.
⚠️ This target, like any measured-move calculation, is a rule of thumb — not a guarantee. Plenty of breakouts fall well short of the projected level, and plenty run right through it and form a new cup on top of the old one ("cup on cup"). As covered in Lesson 6's Risk/Reward and Money Management, treat this number as a reference point for sizing risk against reward, and manage the actual exit with a trailing stop or a scaled-out approach.
Where to Place a Stop
Two stop-loss conventions come up most often:
- A break below the handle's low: if price falls back under the handle's low after entry, the handle is no longer read as a brief pause — it looks more like the start of a real downtrend, and the trade is cut.
- O'Neil's 7–8% rule: CANSLIM methodology is well known for a blanket rule capping losses at roughly 7–8% below the purchase price (typically close to the pivot), regardless of whether the pattern's logic still seems intact. This functions less as a pattern-specific stop and more as an account-level risk-management guardrail.
Which one triggers first depends on the cup's depth and the stock's volatility, so many traders track both and use whichever level is tighter as the actual working stop.
Cup and Handle vs. VCP: What's Actually Different
Lesson 31's VCP (Volatility Contraction Pattern) gets compared to the cup and handle constantly, and the two setups genuinely overlap in plenty of real charts — both are about buying a volume-confirmed breakout after a pullback. But the underlying structure is distinct.
| Cup and Handle | VCP | |
|---|---|---|
| Number of pullbacks | One large pullback (the cup), then one small one (the handle) — two stages total | Usually several (commonly 2–4), each shallower than the last |
| Pullback shape | A rounded U (the cup), followed by a mild downward channel (the handle) | A zigzag where each leg down contracts relative to the prior one |
| Core signal | The cup's rounded bottom plus a shallow handle retracement | The contraction itself — each pullback getting progressively tighter |
| Time to form | Generally longer (weeks to months) | Often forms over a shorter window than a full cup and handle |
| Target calculation | Cup depth (D) projected upward from the pivot | Less standardized — often referenced against the nearest prior resistance or the range's width instead of one fixed formula |
| Common confusion | The handle can resemble the final contraction of a VCP | One of several contractions can look like the right side of a cup |
Both patterns share the same underlying philosophy: confirm, through price and volume behavior, that buying pressure is gradually overwhelming selling pressure. In practice, the cleanest way to tell them apart is whether the pullback shows up as one big rounded move or as a series of progressively tighter ones. When it's genuinely ambiguous, it's more useful to focus on the shared condition both patterns rely on — a volume-confirmed breakout through a defined pivot — than to force a label onto the chart.
FAQ
What if there's no handle and price just breaks out straight from the cup's right side?
It happens, but O'Neil's original methodology treats the handle as an important final round of supply absorption. A breakout that skips the handle entirely is generally considered more prone to failing (breaking out, then rolling back over), which is why more conservative traders often wait for a handle to actually form before entering.
Does a cup deeper than 33% automatically invalidate the pattern?
33% is just a commonly cited upper bound for the "typical" range, not an absolute cutoff. Deep cups in the 40–50% range have been described as still working in volatile markets or with smaller-cap stocks. That said, a deeper cup generally needs stronger buying to fully absorb the larger supply overhang, so it's worth checking the other conditions — volume, broader market trend — more strictly when the cup is unusually deep.
How reliable is the cup and handle pattern in practice?
There's no officially validated, fixed success-rate statistic for this pattern. Outcomes vary a great deal depending on the market regime (bull vs. bear), the stock's underlying fundamentals, and how strictly the confirmation rules are applied, so treat any specific win-rate number you see quoted as unverified. Use it as one signal that buying demand may be reasserting itself — not a standalone predictive tool — and always pair it with a defined stop and a read on the broader market trend, along the lines covered in Lesson 20's Weinstein Stage Analysis.
Limitations and Caveats
- Subjectivity: there's no universal line between "a healthy handle" and "just noise," so different traders can draw meaningfully different patterns on the same chart.
- Long formation time: cups often take months to build, and waiting for the full pattern to complete can mean missing other opportunities in the meantime.
- Hindsight-only certainty: the left side and bottom of the cup are already in the past by the time you're watching the handle form, so all you really know at the breakout is that the shape so far resembles a cup and handle — whether the handle resolves cleanly or rolls into further downside isn't knowable in advance.
- Fakeouts: price briefly clearing the pivot and then failing on weak volume is common. Entering on shape alone, without a closing confirmation and a volume check, is how traders get caught in these traps.
- Market-dependence: a cup and handle breakout in an individual stock is generally considered less likely to hold up when the broader market is in a downtrend, which is why checking the index trend alongside the individual setup is widely recommended.
Summary
- A cup and handle is a continuation pattern within an uptrend, made up of a rounded U-shaped base (the cup) followed by a short, shallow pullback near the highs (the handle).
- A U-shaped cup is generally viewed as more reliable than a sharp V-shape; a prior advance of 30%+ and a cup depth of roughly 12–33% are the ranges most commonly cited.
- A healthy handle forms in the upper half of the cup, retraces no more than about 8–12%, and typically sees volume dry up.
- The buy signal is a volume-confirmed break above the handle's high (the pivot point); the price target is the cup's depth (D) projected upward from that pivot.
- It's distinguished from VCP mainly by structure — one large pullback versus a multi-stage contraction — though both patterns share the same volume-confirmed-breakout philosophy.
- This is an interpretive pattern with no validated success rate, so pair it with a defined stop (a break of the handle's low, or O'Neil's 7–8% rule) and a check on the broader market trend.