Trading Strategies · Lesson 29/57 · 9 min read
Market Profile and TPO Charts: Reading Market Structure Through Time, Not Volume
In this article
- Two Profiles That Look Alike but Aren't
- What a TPO Actually Is: One Letter Every 30 Minutes
- Three Core Building Blocks: POC, Value Area, Initial Balance
- Four Day Types: What Kind of Session Is This?
- Trading It: Initial Balance Breakouts and Value Area Fades
- Market Profile vs. Volume Profile: What Actually Differs
- FAQ
- Limitations and Caveats
- Summary
Two Profiles That Look Alike but Aren't
Lesson 12, Volume Profile and POC Reversion, built support and resistance out of volume stacked at each price level. If you go looking for similar-looking tools on a futures platform, you'll run into another sideways bell-shaped histogram called Market Profile — and it's easy to assume it's the same thing. Both plot a horizontal distribution, both use the terms POC and Value Area, and both are usually filed under "profile" indicators in the same menu.
But the two tools stack a fundamentally different quantity. Volume Profile counts how much size traded at each price. Market Profile counts how much time the market spent there. The method was developed in the 1980s by J. Peter Steidlmayer at the Chicago Board of Trade, back when reliable volume data was hard to come by on the futures floor — the idea was to approximate a market's "fair value" using time instead. Volume data is now trivial to get, but time still carries information volume doesn't, which is why Market Profile remains a staple among futures and index day traders.
What a TPO Actually Is: One Letter Every 30 Minutes
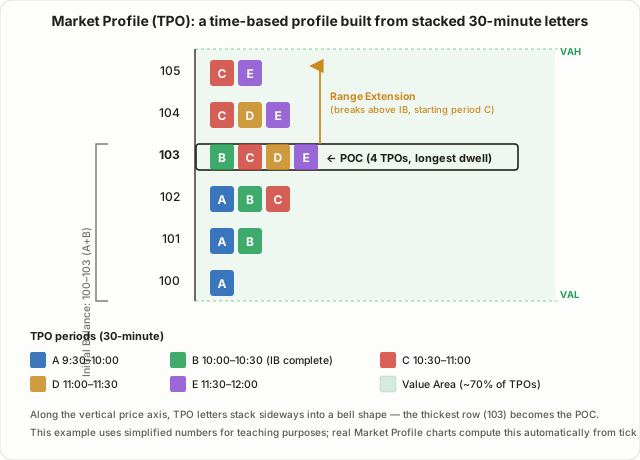
The core unit is the TPO — Time Price Opportunity. The trading session is sliced into 30-minute periods, labeled A, B, C, D, and so on, and each letter is stamped at every price the market touched during that half-hour. When several periods' letters land on the same price, they stack sideways and build the histogram shape.
A small worked example makes this concrete. Say a stock trades as follows:
| Period (TPO) | Time | Prices traded in that half-hour |
|---|---|---|
| A | 9:30–10:00 | 100, 101, 102 |
| B | 10:00–10:30 | 101, 102, 103 |
| C | 10:30–11:00 | 102, 103, 104, 105 |
| D | 11:00–11:30 | 103, 104 |
| E | 11:30–12:00 | 103, 104, 105 |
Counting how many letters stamp each price gives this TPO count:
| Price | TPO letters | Count |
|---|---|---|
| 105 | C, E | 2 |
| 104 | C, D, E | 3 |
| 103 | B, C, D, E | 4 |
| 102 | A, B, C | 3 |
| 101 | A, B | 2 |
| 100 | A | 1 |
Turn that table sideways and you get a bell shape, thickest in the middle at 103 and thinning out toward the edges — the basic Market Profile picture. In practice nobody counts this by hand; TradingView, Sierra Chart, and ATAS build it automatically from tick data.
Three Core Building Blocks: POC, Value Area, Initial Balance
- POC (Point of Control): the price with the most TPO letters. In the example above that's 103, with four letters. Where Volume Profile's POC marks "the price with the heaviest fills," Market Profile's POC marks "the price the market camped at longest."
- Value Area: expanding outward from the POC, the zone that contains roughly 70% of total TPOs — a convention borrowed from the original one-standard-deviation approximation of a normal distribution, not a fixed rule. In the example, starting from the POC (103, 4 letters) and adding whichever adjacent price has more letters first, you need to expand out to roughly 101–105 (12 of 15 letters, 80%) to clear the 70% threshold — real software stops at whichever cutoff lands closest to exactly 70%.
- Initial Balance (IB): traditionally the range built by the first hour of trading (the first two 30-minute TPO periods — A and B here). In the example, the IB is 100–103. It's treated as the range where the day's earliest participants reached rough agreement, and it becomes the reference line for reading everything that follows.
💡 In the example, period C (104, 105) trades outside the Initial Balance (100–103). Price extending beyond the IB like this is called a Range Extension, and it's the single most important clue for classifying the day's type — covered next.
Four Day Types: What Kind of Session Is This?
What sets Market Profile apart from other profile-style tools is that it classifies the character of the trading day directly from the histogram's shape. The four Day Types laid out in Jim Dalton's Mind Over Markets are the most widely cited framework.
| Day Type | Histogram shape | Character |
|---|---|---|
| Normal Day | Roughly symmetric bell | Most of the day stays inside the IB, little to no range extension |
| Normal Variation Day | Bell tilted slightly to one side | IB extends modestly in one direction, then rebalances inside that wider range |
| Trend Day | Stretched long and thin | Range extension fires in one direction as soon as the IB forms, with little to no retracement all session |
| Neutral Day | Stretched long in both directions | IB extends both ways — buyers push higher early, sellers take over later (or vice versa) |
The sample data above — the IB gets broken to the upside in period C, and periods D and E keep trading above it with no pullback — looks like the early signature of a Trend Day. Five 30-minute periods aren't enough to call it definitively, though; a real day type only firms up by watching the full session through the close.
Trading It: Initial Balance Breakouts and Value Area Fades
Market Profile is generally traded in one of two opposing ways.
1) Initial Balance breakout. If the IB forms narrow — meaning the market opened without much conviction either way — a strong subsequent break out of that range is traded as a trend-following signal in the breakout direction. The logic: a narrow IB means the market genuinely hasn't picked a side yet, so whatever direction it breaks afterward is more likely to carry real information. Conversely, when the IB opens unusually wide, that early volatility is often treated as having already been "spent," and further breaks out of it are given less credibility.
2) Value Area fade. If the session instead looks like it's shaping up as a Normal Day, some traders fade price back toward the POC whenever it touches the Value Area High (VAH) or Value Area Low (VAL) — a mean-reversion entry. This is the same underlying logic covered in Lesson 10, Four Flavors of Mean Reversion, except the reference line is pulled directly from that day's TPO structure instead of a statistical indicator.
These two setups rest on opposite assumptions, which matters in practice: an IB breakout is a bet that today is a Trend Day, while a Value Area fade is a bet that today is a Normal Day. Rather than committing to one approach before the session opens, most traders watch how the Initial Balance forms and whether range extension shows up, form a provisional read on the day type, and then pick the setup that matches it.
Market Profile vs. Volume Profile: What Actually Differs
These look like siblings, but the practical implications diverge quite a bit.
| Market Profile (TPO) | Volume Profile | |
|---|---|---|
| What it accumulates | Time (count of 30-min TPO letters) | Volume (executed size) |
| Data required | Price alone is enough | Needs accurate volume data |
| What distorts it | Long dwell time even on thin volume | A brief volume spike, even if price barely lingers |
| Concepts unique to it | Initial Balance, Day Types, Range Extension | None — these concepts don't exist here |
| Where it's strongest | Reading the structure and rhythm of the session | Reading the actual weight of executed size |
The two diverge most visibly when price parks in a quiet, low-volume stretch. During a lunchtime lull, for instance, thin volume can still sit in a tight range for a long stretch of clock time — Market Profile keeps stacking TPO letters there and builds a thick node, while Volume Profile shows it as thin because so little actually traded. Flip it around: a volume spike that fires and clears in seconds builds a thick node on Volume Profile, but barely registers on Market Profile because the market didn't dwell there. Neither is "more correct" — they're answering different questions, and plenty of traders run both side by side, treating the price where the two POCs overlap as a more reliable support/resistance level than either alone.
FAQ
Does Market Profile work on stocks, or only futures?
It can be applied to stocks, but it was built for CBOT futures floor trading, and it's generally considered more reliable on instruments that trade near-continuously with concentrated liquidity — index futures (ES, NQ) and large-cap names. Thinly traded, wide-spread small caps tend to distort the TPO structure enough that the reading gets noisy.
Do I have to use 30-minute periods?
No — 30 minutes is CBOT's traditional convention, not a rule. Some traders slice TPOs into 5–15 minute periods for volatile names or short-term scalping, and others merge multiple sessions into weekly or monthly profiles to read longer-term support and resistance.
If the Initial Balance opens unusually wide, should I sit the day out?
Not necessarily, but an abnormally wide IB is often a sign that a news event or catalyst already burned through a big chunk of the day's volatility before the session properly got going. On those days, IB breakouts tend to carry less reliability, so many traders either stand aside or size down rather than force a directional bet. This is a widely cited practitioner heuristic, not a validated rule — treat it that way.
Limitations and Caveats
- It's confirmed only in hindsight. A Day Type only fully resolves once the session closes. Intraday, you can only form a provisional read — "this is starting to look like a Trend Day" — and a morning that looks trending can easily give way to an afternoon reversal that closes as a Normal Variation Day instead.
- It was built for a market that traded differently. Market Profile encodes the behavior of human floor traders from the 1980s. Whether the same structure still holds up now that algorithmic and high-frequency flow dominates volume is genuinely debated among traders — treat it as one useful lens, not an immutable law.
- Platforms don't compute it identically. The TPO period length, the Value Area percentage (70% is convention but adjustable per platform), and the exact Day Type classification rules all vary slightly by software. Don't be surprised if the POC or IB you see differs slightly from tool to tool on the same instrument.
- Never trade it in isolation. The risk filters from Lesson 13, ATR Stops, Net-Edge Filters, and Flow Confirmation, apply just as much to Market Profile entries as to anything else in this course. Whether you're trading an IB breakout or a Value Area fade, define your stop and position size separately before you enter.
Summary
- Market Profile builds a time-based distribution from 30-minute TPO letters, tracking how long price dwelt at each level — a fundamentally different quantity from Volume Profile's volume-based approach.
- Its three building blocks are the POC (longest dwell time), the Value Area (roughly 70% of TPOs), and the Initial Balance (the first hour's range).
- Four Day Types — Normal, Normal Variation, Trend, and Neutral — classify the session's character, with Range Extension beyond the Initial Balance as the key tell.
- The two dominant setups, Initial Balance breakouts and Value Area fades, rest on opposite assumptions about the day, so most traders watch the IB form before committing to either.
- Market Profile and Volume Profile answer different questions rather than competing directly — many traders run both and weight the price where their two POCs overlap more heavily.