Trading Strategies · Lesson 31/57 · 10 min read
VCP (Volatility Contraction Pattern): Mark Minervini's Pivot Breakout Strategy
In this article
- VCP: The Tighter the Coil, the Harder It Springs
- Why Repeated Contractions Raise the Odds
- The Structure: How Many Contractions Does It Take
- The Pivot Point and Entry Timing
- Stops and Risk Management
- A Worked Numeric Example (Simplified, Educational)
- VCP vs. Cup and Handle: What's the Difference
- Limitations to Keep in Mind
- How It Compares to Other Lessons
- FAQ
- Summary
VCP: The Tighter the Coil, the Harder It Springs
The Volatility Contraction Pattern (VCP) was formalized by Mark Minervini, a U.S. investing champion and author of Trade Like a Stock Market Wizard. The core idea is simple: when a stock that has already rallied hard goes into a pullback, watch whether each successive pullback gets shallower than the last. The setup is to buy the breakout that comes once that contraction has tightened as far as it's going to.
This is a different animal from the trend-following in Lesson 1 or the mean reversion in Lesson 3. It isn't a directional indicator at all — it's closer to reading, directly off price structure, the point where sell-side supply has largely dried up. It's also one of the setups that keeps coming up in retail trading communities and growth-stock swing-trading content.
Why Repeated Contractions Raise the Odds
When a stock that just ran hard starts pulling back, the depth of each pullback tells you something about who's still holding and why.
- The first pullback tends to run relatively deep, as late buyers from the run-up take profit while new buyers stay on the sidelines waiting to see how far it falls.
- The second pullback tends to hold up better against the same news or market noise, because the shares still in the float have already survived one shakeout — the weak hands are largely gone.
- By the third pullback, most of the sellers who wanted out have already sold, and the remaining holders have little reason to dump at a lower price. Supply thins out to the point where even modest buying can push price up with little resistance.
So the point of VCP isn't "volatility going down" for its own sake — it's using the shrinking size of each pullback as a proxy for how much sell-side supply has been worked through. Minervini's own analogy is a coil: the tighter it's compressed, the harder it snaps back when released. This is the same "compression before expansion" logic as the TTM Squeeze in Lesson 14 — but where the squeeze measures compression through a statistical band width, VCP measures it by eyeballing the actual retracement depth of each individual swing high and low.
The Structure: How Many Contractions Does It Take
A textbook VCP forms as a stock in an uptrend pulls back in a staircase pattern like this:
- First contraction: a relatively deep pullback from the prior high (a range of roughly 20-30% is commonly cited as a rough starting point)
- Second contraction: shallower than the first (commonly cited around 10-15%)
- Third contraction (optional): shallower still — often single digits, sometimes described as "tightening up"
Ideally, each contraction's low sits above the previous contraction's low, meaning buyers are stepping in at progressively higher prices with each pullback. Volume matters just as much as price here — volume should dry up as the contraction progresses (a sign fewer people are left to sell), and it's widely treated as good practice that it should pick up noticeably on the eventual breakout.
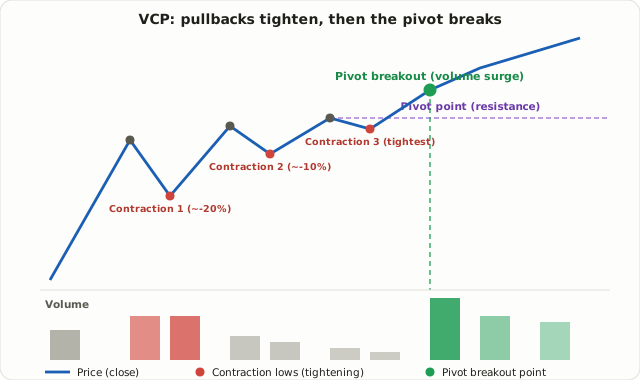
There's no fixed number of contractions required, but in practice traders commonly look for at least two, often citing a range of two to four. A single contraction doesn't give much confidence that supply is actually exhausted, while a pattern that drags on with too many contractions over too long a stretch (say, several months) is sometimes viewed as having lost its energy. This is a widely shared rule of thumb among traders, not a validated fixed rule.
The Pivot Point and Entry Timing
In VCP terms, the pivot point is the resistance level of the final, tightest contraction — typically its high. The entry rule breaks down as follows:
- Price clears the pivot point (on a close, or intraday, depending on the trader's convention)
- Volume on the breakout day runs meaningfully above normal (versus, say, the 50-day average) — a figure like 40-50% above average gets cited often, but treat it as a rough guideline rather than a hard threshold
- Entry is taken with a small buffer just above the pivot itself, rather than exactly at it
Buying a pivot break with no volume confirmation means entering without any real evidence that supply has actually cleared out — which leaves the trade exposed to a false breakout. When volume does surge on the break, sidelined capital chasing the move and short covering from anyone positioned against it tend to pile in together, which is part of what accelerates the move — a smaller-scale version of the same supply/demand mechanics behind the short squeeze in Lesson 23.
Stops and Risk Management
The stop rule in VCP trading is unambiguous — the low of the final, tightest contraction that justified the entry. If that low breaks, the whole premise (that supply had been exhausted) is wrong, and the standard practice is to exit without hesitation.
Because the gap between the contraction low and the pivot naturally shrinks as the pattern tightens, the stop distance shrinks along with it — this is one of the setup's biggest selling points. Through the risk/reward lens from Lesson 6, a tighter stop means a more favorable risk/reward ratio for the same position size. That said, the same minimum-stop-distance logic from the Lesson 13 filters still applies: a stop tighter than the stock's normal daily range (ATR) is at greater risk of getting stopped out by ordinary noise.
A common convention caps total risk at roughly 7-10% below entry, echoing Minervini's broader emphasis on never letting a loss grow large. If a setup's natural stop distance comes out wider than that, many traders take it as a sign the contraction hasn't tightened enough yet, and simply pass on the trade.
A Worked Numeric Example (Simplified, Educational)
The numbers below are a simplified hypothetical example meant to illustrate the mechanics — not a real, backtested trade record.
| Stage | Price | Description |
|---|---|---|
| Rally begins | $50 | Enters a strong uptrend on rising volume |
| First high | $100 | Up 100%, pullback begins |
| Contraction 1 low | $80 | -20% from the high |
| Second high | $105 | Marginal new high, volume lighter |
| Contraction 2 low | $95 | -9.5% from the high, above contraction 1's low of $80 |
| Third high (pivot) | $108 | Volume dries up further, range tightens |
| Contraction 3 low | $104 | -3.7% from the high — the shallowest contraction |
| Breakout entry | $108.30 | Clears the pivot on a volume surge |
| Stop | $103.80 | Just below the contraction 3 low |
Risk here works out to roughly 4.2% of entry ($4.50 / $108.30). If the stock later runs to $130, the gain is about $21.70 — roughly 4.8x the initial risk (an "R multiple" of about 4.8R). As covered in Lesson 6, a setup with a favorable risk/reward ratio like this can still be profitable over the long run even with a win rate well under 50%.
VCP vs. Cup and Handle: What's the Difference
VCP gets compared to the "Cup and Handle" pattern often, and for good reason — both trace back to William O'Neil's growth-stock trading tradition, and both are fundamentally about buying a breakout after a period of consolidation. In practice, the handle portion of a large cup-and-handle formation often turns out, on closer inspection, to be made up of several smaller VCP-style contractions of its own.
| Cup and Handle | VCP | |
|---|---|---|
| Shape | A rounded (U-shaped) base, followed by a short, shallow handle near the right side | A staircase of progressively shallower pullbacks |
| Number of pullbacks | One large one (the cup) plus one small one (the handle) | Typically 2-4 repeated contractions |
| How it's judged | The overall curve — is it rounded, roughly symmetric | Whether each successive contraction's depth actually shrinks (a numeric comparison) |
| Flexibility | Reliability is generally seen as tied to matching the expected shape | Focused less on shape, more on the direction of travel — is it tightening |
Neither is strictly better — cup and handle reads the big-picture shape, while VCP is a finer-grained way to quantify the degree of contraction happening inside that shape. Many traders use both lenses side by side.
Limitations to Keep in Mind
- Subjectivity: What counts as "tight enough" varies from trader to trader. Even screening tools that flag precise percentage thresholds still leave the final call to judgment.
- False breakouts: It isn't uncommon for a stock to clear the pivot without real volume support, then drift back into the range. Checking whether price actually holds above the pivot for a few days afterward is a common way to filter these out.
- Regime dependence: VCP reads individual-stock supply and demand, but it's widely observed that breakout failure rates rise when the broader market is in a clear downtrend (Stage 4 in Lesson 20's framework). Checking the overall market trend alongside the setup is generally recommended.
- Hard to confirm in real time: While the pattern is still forming, it's genuinely difficult to tell "a real VCP" apart from "a pullback that's simply falling apart" — clarity often only arrives in hindsight, after the breakout has already happened.
How It Compares to Other Lessons
| [Lesson 14] TTM Squeeze | [Lesson 20] Weinstein Stage Analysis | [Lesson 21] Wyckoff Accumulation | VCP | |
|---|---|---|---|---|
| How compression is measured | Band width (a statistical indicator) | The slope and position of the 30-week MA | A combination of volume and price range | The actual retracement depth of individual swings |
| Primary timeframe | Any (scalping through swing) | Mostly weekly (medium to long term) | Mostly daily (medium term) | Mostly daily/weekly (swing to medium term) |
| Determining direction | Requires a separate momentum histogram | Entering Stage 2 is itself the bullish signal | Confirmed by SOS after the spring | The pivot breakout itself is the entry signal |
VCP is often described as most reliable when it shows up in a stock already in Weinstein's Stage 2 uptrend with strong relative strength. Rather than trading VCP in isolation, a common combination is using stage analysis first to filter down to stocks already in an uptrend, then using VCP within that shortlist to time the specific entry.
FAQ
What timeframe should I use to spot a VCP — daily or weekly?
The most common approach is confirming the contraction structure on the daily chart while checking the weekly chart for the bigger picture — is the stock in an uptrend, is it near a new high. Shorter timeframes show contractions more often but tend to be less reliable, so daily charts are the usual default for swing trading purposes.
Should I learn cup and handle or VCP first?
There's no fixed order, but it's usually easier to learn cup and handle first to grasp the broad "consolidate, then break out" idea, then use VCP to judge the strength of the contraction in finer detail. In practice the two aren't mutually exclusive — many traders use both together.
Does it not count as a VCP if there are fewer or more than three contractions?
No, that's not a fixed rule. What matters more than the exact count is the direction of travel — are the lows getting higher, is the range getting tighter, is volume shrinking alongside it. That said, a single contraction usually isn't enough to build real confidence, and a pattern that drags on for too long (say, more than half a year) raises the odds that something else is now driving the consolidation.
Summary
- VCP identifies a pattern where a stock's pullbacks get progressively shallower during an uptrend, using that shrinking range as a proxy for sell-side supply being worked through in stages.
- It typically plays out over 2-4 contractions, ideally with each low sitting above the prior one and volume drying up alongside the tightening range.
- Entry comes on a volume-confirmed breakout above the pivot — the resistance of the final, tightest contraction — with a stop at that contraction's low; tighter contractions mean tighter stops and a more favorable risk/reward ratio.
- Where cup and handle reads the big-picture shape, VCP is a finer-grained way to quantify how much the pullbacks inside that shape are actually contracting.
- Real limitations include subjectivity, false breakouts, and dependence on the broader market regime — which is why many traders filter for uptrending stocks with stage analysis first, then use VCP purely for entry timing.