Trading Strategies · Lesson 32/57 · 11 min read
Gap and Go Strategy: Pre-Market Gap Scanning and Float Rotation Explained
In this article
- Gap and Go: Riding the Price Void Left Overnight
- Why Gaps Form, and Why They Keep Running
- Screening Criteria: Which Gaps Are Worth Trading
- Float Rotation: Measuring Real Firepower Against the Float
- Entry Rule: The Opening Range Breakout
- Stops and Risk Management
- A Worked Numeric Example (Simplified, Educational)
- Gap and Go vs. First Red Day: Trading the Same Gap in Opposite Directions
- Limitations to Keep in Mind
- How It Compares to Other Lessons
- FAQ
- Summary
Gap and Go: Riding the Price Void Left Overnight
Gap and Go is a day trading setup built around stocks that open with a large price gap between yesterday's close and today's open, then keep pushing in that same direction once the bell rings. It's one of the most widely taught setups in the small-cap momentum trading world — Warrior Trading and similar communities have run it as a core lesson for years, and it's still one of the setups that keeps showing up across trading-education videos and blogs.
This lesson builds on the support/resistance breakout in Lesson 4 and the opening range breakout (ORB) in Lesson 11, but it isn't the same trade. ORB treats "a break of the first few minutes' range" as the signal regardless of whether a gap exists. Gap and Go is narrower and more specific: the overnight gap itself — driven by news, earnings, or a filing — is the signal, and it's screened alongside the stock's float structure.
Why Gaps Form, and Why They Keep Running
A gap forms because new information hits while the regular session is closed, and only a limited set of participants can act on it before the bell. Earnings surprises, FDA approvals, M&A announcements, and analyst upgrades are the classic triggers. When the market opens, the buy (or sell) orders that stacked up overnight get filled essentially all at once, and the open itself lands well away from the prior close.
What matters more than the gap itself is whether it keeps extending after the open. A few overlapping mechanics tend to drive that continuation:
- Staggered information spread: some participants already knew the news pre-market and positioned early, while others only see it once the regular session opens and buy in late. That lag keeps fresh buying pressure coming in for a while after the bell.
- Short entries turning into forced buying: traders who think the gap is overdone often short into the initial strength, capping the early move. If price keeps climbing anyway, those shorts start covering under pressure, which adds fuel to the rally — the same feedback loop covered in Lesson 23 on short squeezes, just compressed into a much shorter timeframe.
- Scanner-driven piling on: traders running real-time gap and volume scanners are all watching the same short list of names. Once early strength confirms, several of them buy in together, which tends to make the move self-reinforcing.
Not every gap behaves this way, though. It's just as common for early buying to run out of steam and for price to fade back and fill the gap — that risk needs to be on the table from the start, not treated as an edge case.
Screening Criteria: Which Gaps Are Worth Trading
In practice, a gap and go scanner usually filters for four conditions at once. The figures below are conventions that show up repeatedly across trading-education content — not validated, fixed rules.
| Criterion | Common convention | What it signals |
|---|---|---|
| Gap size | Roughly 5-15%+ versus prior close | Too small is noise; too large may already be exhausted by entry |
| Catalyst | Earnings, a filing, an approval, M&A, an analyst call change | A gap with no clear reason is more likely supply/demand distortion than real information |
| Pre-market volume | Roughly 5-10x the stock's normal pre-market volume | Evidence that real interest has actually shown up |
| Float | Small-cap growth names typically run from a few million up to tens of millions of shares | A smaller float means the same buying pressure moves price further |
Traders who run this setup regularly tend to agree that missing any one of these four conditions meaningfully lowers the odds. A gap on high volume with no identifiable catalyst is a particular red flag — it can be a ticker mix-up, a data error, or simply noise, which is why checking the actual news headline is treated as a non-negotiable step, not an optional one.
Float Rotation: Measuring Real Firepower Against the Float
Float rotation is the day's cumulative trading volume divided by the stock's float — the portion of shares actually available for trading in the open market.
Float rotation = today's cumulative volume ÷ float
For example, a stock with an 8-million-share float that trades 16 million shares in a day has rotated its float twice (2x) — meaning the entire pool of freely tradable shares has, in theory, changed hands twice over.
This matters because repeated rotation is commonly read as a sign that the supply that was sitting overhead at lower prices has largely been worked through, and the share base is being re-priced around a new, higher average cost. Below 1x rotation, most of the existing holder base likely hasn't sold yet, so even modest selling can stall the move. A stock that's rotated several times over has burned through much of that resistance — but the tradeoff is that volatility tends to run just as extreme in the other direction too.
Float rotation is best used as a relative comparison — "how many multiples of normal turnover is this stock seeing today" — rather than a fixed absolute threshold. A rule like "must be above 2x" is a rough heuristic that varies by stock and by market regime, not a validated cutoff.
Entry Rule: The Opening Range Breakout
The actual entry in a gap and go trade is anchored to the high of the opening range — typically the first 1 to 5 minutes of the regular session.
- Mark the high and low of the first 1-minute (or 5-minute) candle after the open as the opening range.
- Enter once price clears that range's high on a volume surge — fills typically land just above the range high itself, not exactly at it.
- Check that the entry price sits above VWAP. A breakout happening below VWAP means the average participant who's bought so far is still underwater on the day, which many traders treat as a lower-confidence signal.
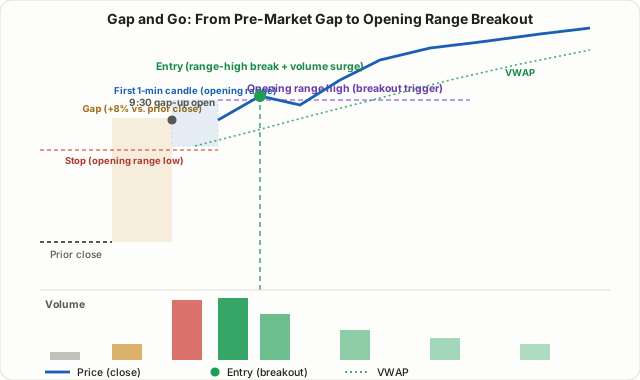
Entering earlier — right at the open — offers more upside but also carries a higher chance of getting caught in a false break. That's why a more conservative approach many traders use is to wait through the first five minutes or so and confirm a pattern of higher lows before committing, rather than acting off the first 1-minute candle alone.
Stops and Risk Management
Because gap and go names are mostly low-float, high-volatility small caps, they demand tighter risk discipline than most of the setups covered elsewhere in this course.
- Stop placement: the opening range low, or roughly 2-3% below entry — whichever is closer. Combining this with the ATR-based minimum-stop filter from Lesson 13 helps avoid setting a stop tighter than the stock's normal intraday range.
- Risk per trade: capping risk at 1-2% of account equity per trade is a widely used convention. Low-float names carry wide bid-ask spreads and heavier slippage, so ignoring this cap tends to produce losses considerably larger than the stop distance would suggest.
- Liquidity risk: a small float makes it easy to buy in but can make it hard to sell a meaningful size near the price you want, especially on the way out. Before entering, it's worth asking whether your position size can actually be exited near your target price.
- Halt risk: markets with volatility circuit breakers — the U.S. LULD (Limit Up-Limit Down) mechanism, for instance — can pause trading mid-move, potentially trapping a position during the halt.
A Worked Numeric Example (Simplified, Educational)
The numbers below are a simplified hypothetical example meant to illustrate the mechanics — not a real, backtested trade record.
| Item | Value | Note |
|---|---|---|
| Prior close | $4.20 | — |
| Float | 9 million shares | Small, low-float name |
| Catalyst | Positive Phase 2 trial data | Clear, identifiable news |
| Pre-market volume | 4.5 million shares | Roughly 12x normal |
| Open (9:30) | $4.90 | +16.7% gap vs. prior close |
| First 1-min high/low | $5.15 / $4.75 | Opening range |
| Entry | $5.18 | Just above range high, confirmed above VWAP |
| Stop | $4.75 | Opening range low |
| Cumulative volume, 9:30-10:00 | 19.8 million shares | Roughly 2.2x float rotation |
| Target exit | $6.10 | Morning session highs |
Risk here works out to $0.43 per share; hitting the target would return $0.92 per share, for a risk/reward ratio of roughly 2.1R. As covered in Lesson 6, a setup with a favorable risk/reward ratio like this can stay profitable over time even with a win rate under 50%. That said, low-float small caps can move that same distance in the opposite direction just as fast — that asymmetric risk never goes away.
Gap and Go vs. First Red Day: Trading the Same Gap in Opposite Directions
If gap and go is the long-side play on the first burst of gap-up momentum, its mirror image is First Red Day — a short strategy that targets the moment a stock that's run hard for several straight days finally breaks. Both setups live in the same low-float, high-momentum universe, but the entry logic runs in opposite directions.
| Gap and Go (long) | First Red Day (short) | |
|---|---|---|
| Phase targeted | Gap-up day, early momentum | After 3+ consecutive up days, the first day momentum breaks |
| Entry trigger | Break above the opening range high | Price drops below the prior day's close (turns "red") |
| Underlying premise | Fresh buying keeps pushing the gap higher | Late buyers are underwater; profit-taking and stop-outs accelerate |
| Main directional risk | Gap fade (early strength fails and reverses hard) | Short squeeze (the stock keeps climbing anyway) |
| Barrier to entry | Rules are comparatively simple | Requires shortable shares and borrow availability, a higher bar to clear |
Both setups share the same underlying premise — low-float stocks can overshoot violently in either direction — but gap and go tries to catch that overshoot as it starts, while First Red Day tries to catch it as it exhausts. Gap and go is often cited as the more approachable entry point for newer traders, mainly because it doesn't require short-selling infrastructure to execute.
Limitations to Keep in Mind
- Low reproducibility: stocks with a genuine news catalyst plus a low-float structure don't show up every day, and even when one does, spreads and slippage can create a meaningful gap between the theoretical numbers and actual fills.
- Gap fade risk: it isn't uncommon for a stock to run briefly on opening momentum, then give back a large chunk of the gap as pre-market holders take profit into the strength. Skipping the opening-range-low stop leaves a trade fully exposed to that reversal.
- Commission and slippage load: this is a fast, frequent-trade setup, which makes the net-profit filter from Lesson 13 — checking real expected return after costs, not just the gross move — especially important here.
- Regulatory constraints: in U.S. markets, trading frequently within a day can trigger pattern day trader (PDT) rules, including minimum account equity requirements. Check the relevant market's and broker's rules before trading this setup live.
How It Compares to Other Lessons
| [Lesson 11] Donchian / ORB | [Lesson 23] Short Squeeze | Gap and Go | |
|---|---|---|---|
| Requires a gap | No — the intraday range break is the core signal | No — short interest unwind is the core driver | Yes — a large gap versus prior close is a precondition |
| Typical holding window | Day trading, general | Days to weeks (medium term) | Minutes to tens of minutes, on the gap day itself |
| Primary filters checked | Recent N-bar range | Short interest ratio, days to cover | Gap size, pre-market volume, float rotation |
Gap and go is best thought of as a specialized subtype of ORB — one with two extra filters layered on: why attention landed on this stock in the first place (the catalyst), and how much real turnover that attention is actually producing (float rotation).
FAQ
Is gap and go a beginner-friendly strategy?
The rules themselves are simple, but executing them requires handling low-float, high-volatility stocks within a short window, which isn't easy in practice. It's worth practicing opening-range judgment and fast stop execution in a simulator or with small size before committing real capital.
Where do I check float rotation?
Most real-time quote and scanner platforms provide both the day's cumulative volume and the stock's float, so you can divide the two directly, or use a scanner's built-in rotation metric. Note that float refers to actually tradable shares, not the company's total shares outstanding — the two numbers can differ significantly.
Is a bigger gap always a better signal?
No. An extremely large gap (say, 50%+) can mean most of the early buying pressure already burned itself out pre-market, which raises the risk of heavy profit-taking right as the regular session opens. Gap size on its own matters less than weighing it together with catalyst strength and pre-market volume.
Summary
- Gap and go is a day trading setup that confirms a large overnight gap with an opening-range-high breakout, then rides the early momentum that follows.
- A higher-confidence setup combines four conditions: a reasonable gap size, a clear news catalyst, pre-market volume well above normal, and a small float.
- Float rotation (day's volume ÷ float) measures how many times a stock's tradable shares have turned over in a session, and repeated rotation is commonly read as a sign that prior selling resistance is being worked through.
- Entries are confirmed with an opening-range-high break above VWAP, with stops kept tight — the opening range low, or roughly 2-3% from entry.
- The mirror-image play, First Red Day, targets the first breakdown after a multi-day run; both setups trade the same low-float volatility, and both carry the opposite-direction risk built into that volatility — gap fade on one side, short squeezes on the other.