Trading Strategies · Lesson 79/79 · 9 min read
The Overnight Effect: Why Close-to-Open Returns Beat the Trading Day
In this article
- Most of a Stock's Return Happens While the Market Is Closed
- Three Explanations for Why Gains Cluster at Night
- Overnight Holding vs. Pure Day Trading
- A Worked (Hypothetical) Example
- The Effect Appears to Be Fading
- Three Practical Obstacles
- The Leveraged-ETF Connection
- Limitations and Pitfalls
- FAQ
- Summary
Most of a Stock's Return Happens While the Market Is Closed
Every trader checks "how much did it move today" by watching the regular session. But a different question has been getting attention from quant researchers and academics in recent years: does a stock's long-run gain actually come from the hours the market is open (open-to-close), or from the hours it's closed (close-to-open, i.e. overnight)? This split is what's known as the overnight effect, or overnight drift.
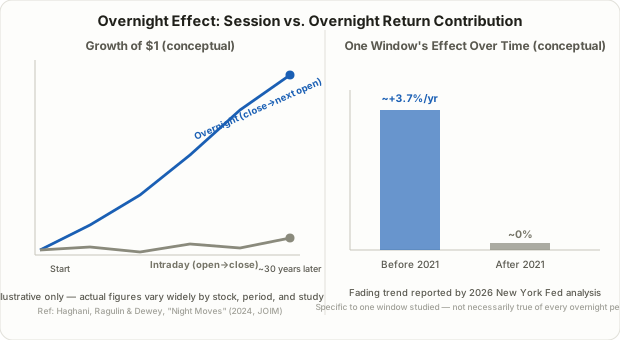
The answer is counterintuitive. "Night Moves: Is the Overnight Drift the Grandmother of All Market Anomalies?" — a 2024 paper by Victor Haghani, Vladimir Ragulin, and Richard Dewey that won the Journal of Investment Management's 2024 Harry Markowitz Award (presented in 2025) — found that $1 invested in SPY (the S&P 500 ETF) over the past 30 years, held only open-to-close, would have grown to roughly $1.21. The same dollar held only close-to-open — overnight, while the market was shut — would have grown to roughly $17.17. Bloomberg columnist Aaron Brown, citing this research, noted that in 22 of 24 countries studied, holding the major index only during market hours since 1990 would have lost money, even before accounting for any trading costs.
Most strategies in this course focus on which direction price moves. The overnight effect asks a different question: even when a stock ends up higher, which part of the day that gain actually came from. That's not just academic trivia — it's directly relevant to whether day trading and swing/overnight holding are fighting for an edge in the same statistical environment, or in two very different ones.
Three Explanations for Why Gains Cluster at Night
There's no single, settled cause academics agree on, but three explanations recur across the research.
- Retail buying concentrated at the open. Research out of the University of Georgia argues that retail investors digest news and social-media chatter after the close, then place buy orders right as trading resumes the next morning. Market makers don't immediately absorb that demand at face value — they price in some uncertainty about whether the buying reflects genuine new information, which can push the price up a notch right around the open.
- Compensation for carrying overnight inventory. A 2026 New York Fed analysis frames overnight drift as compensation paid to liquidity providers who absorb order imbalances that build up right before the close and then have to carry that position overnight, unwinding it (and nudging price back up) the next morning.
- Macro and earnings news cluster outside market hours. Corporate earnings releases and major economic data are, by convention, heavily concentrated before the open or after the close — much like the dynamics covered in Lesson 69 on trading FOMC and CPI releases. If the information that actually moves markets tends to land outside regular hours, it's not surprising that a disproportionate share of the resulting price move lands there too.
None of these is a fully settled, mutually exclusive cause — they're better understood as contributing, overlapping factors rather than one proven mechanism.
Overnight Holding vs. Pure Day Trading
The clearest way to think about the overnight effect is to compare two hypothetical approaches to the same stock that differ only in which window of the day they hold through.
| Aspect | Overnight-hold approach | Pure day trading |
|---|---|---|
| Holding window | Buy at the close, sell at next day's open | Buy at the open, sell at that day's close (or earlier) |
| Main risk exposure | Gap risk from news/earnings released while the market is shut | Intraday volatility, but no exposure to after-hours news |
| Liquidity environment | Fills happen right around the open/close, where spreads are often comparatively tight | Spreads and depth are generally best during the regular session |
| What research tends to report | A large share of long-run index returns concentrated in this window, historically | Comparatively weak or even negative average returns in many of the same studies |
| Recent trend | Some of the clearest windows reportedly weakened after 2021 | Intraday volatility itself hasn't gone away |
| Practical friction | Gap risk, overnight financing/swap costs | Cumulative commissions and slippage from frequent trades |
Neither side of this table is a verdict that one approach is simply "better." A reported historical edge in the overnight window doesn't invalidate momentum, breakout, or order-flow strategies that specifically trade intraday volatility — those strategies are built around a different mechanism, operating in a different part of the day.
A Worked (Hypothetical) Example
Consider a hypothetical five-day stretch where a stock opens Monday at $100.00 and closes Friday at $103.00 — a 3% gain for the week. Where that 3% actually came from can look very different depending on how you slice the day:
| Day | Open | Close | Intraday return (open→close) | Overnight return (prior close→open) |
|---|---|---|---|---|
| Mon | $100.00 | $100.50 | +0.50% | — |
| Tue | $100.20 | $99.80 | −0.40% | −0.30% |
| Wed | $101.20 | $101.00 | −0.20% | +1.40% |
| Thu | $100.90 | $101.80 | +0.89% | −0.10% |
| Fri | $102.60 | $103.00 | +0.39% | +0.79% |
Summing the intraday column gives roughly +1.18%, while summing the overnight column gives roughly +1.79% — the larger share of the week's total gain. These numbers are entirely illustrative, built only to show how the same reported 3% weekly gain can split very differently between the two windows; they say nothing about any real stock's actual statistics. The point is the method: a daily chart alone only shows "+3% this week," but splitting open and close reveals where that return actually originated.
The Effect Appears to Be Fading
The most important recent wrinkle is that this effect is reportedly shrinking. The 2026 New York Fed analysis found that one specific afternoon window, which had historically generated roughly 3.7% annualized in excess return, has averaged close to zero since 2021. That's a useful reminder that the overnight effect isn't a free, permanent subsidy — like any documented market anomaly, it can compress as more capital tries to capture it.
The attempt to package it as a product illustrates the same point. Exchange-traded funds designed specifically to hold the overnight window (branded as "night" funds) were launched, but reportedly failed to gather enough assets and were wound down. That gap between an average effect visible in long-run academic data and a product that can reliably deliver it to ordinary investors is worth keeping in mind before treating any backtest number as directly tradeable.
Three Practical Obstacles
- Gap risk. News, earnings, and macro events that land while the market is shut can move the next open far from the prior close — in either direction. As discussed in Lesson 38 on IV crush around earnings, the closed-market window is also where the sharpest price shocks tend to land. An average historical edge doesn't remove the risk on any single night.
- Transaction costs and slippage. Buying every close and selling every next open means hundreds of round trips a year. Once realistic spreads, commissions, and execution slippage are applied, a meaningful share of any academically reported edge can disappear — the same net-of-costs discipline covered in Lesson 13's risk filters applies directly here.
- Thin liquidity outside the open/close moments. Spreads widen and depth thins in the hours furthest from the open and close. The assumption of filling exactly at the theoretical close or open price is harder to guarantee in live trading than it looks on a spreadsheet.
The Leveraged-ETF Connection
It's worth connecting this to Lesson 72 on leveraged ETF volatility decay. Daily-rebalancing leveraged products like TQQQ or SOXL generate structural rebalancing demand concentrated right around the close and the next open, and some researchers link that flow to the order imbalances that drive one of the proposed causes of overnight drift. The two phenomena aren't the same mechanism, but as leveraged and other daily-rebalancing products grow as a share of trading volume, their footprint on close/open order flow is a factor worth keeping in mind.
Limitations and Pitfalls
- An average doesn't guarantee any single night. A 30-year cumulative edge is a long-run average; any specific overnight holding period can still produce a sharp loss.
- The effect changes over time. As the New York Fed's own findings show, a pattern that was once pronounced can compress or vanish — this is a documented tendency, not a fixed law of markets.
- It varies by stock and market. Research suggests the effect is stronger in names with heavy retail participation (meme stocks, high-volatility growth names) and weaker in deeply liquid, institutionally dominated large caps.
- Most research is US-market specific. The studies cited here are overwhelmingly built on US data (SPY, S&P 500). Markets with different trading hours, settlement conventions, and investor composition need their own separate analysis before assuming the same pattern applies.
- Financing and tax costs add up. Margin interest for holding overnight, and currency or tax treatment for cross-border positions, can further erode whatever theoretical edge remains.
FAQ
Is the overnight effect still real today?
It depends on the window and period studied. Long-run, multi-decade data still tends to show a large overnight contribution, but recent analysis — like the New York Fed's finding that one specific window's effect faded to near zero after 2021 — shows this isn't guaranteed to persist. Treat "it existed historically" and "it will behave identically going forward" as two separate claims.
Can I just buy every close and sell every next open?
That's the simplified version of the idea, but transaction costs, slippage, and gap risk can erode or eliminate the theoretical edge in practice. The fact that ETFs built specifically to capture this pattern struggled to gather assets and were wound down is a concrete reminder that a statistically observed average and a reliably tradeable product are two different things.
Does this mean day trading is a bad idea?
Not necessarily. A day trader who closes every position before the bell is, in a statistical sense, trading in the window that several studies report as comparatively weaker on average. But that doesn't make day trading inferior — intraday strategies (momentum, order flow, breakouts) target a different mechanism entirely, carry less gap exposure, and the overnight window's reported edge comes bundled with the gap risk that day trading specifically avoids.
Summary
- The overnight effect (overnight drift) is the repeatedly documented tendency for a large share of a stock's long-run return to come from the hours markets are closed (close to next open) rather than from the regular session (open to close).
- The 2024 "Night Moves" paper, winner of the 2024 Harry Markowitz Award, found that $1 held only intraday in SPY over 30 years grew to roughly $1.21, versus roughly $17.17 held only overnight — and that holding only during market hours would have lost money in 22 of 24 countries studied since 1990.
- Proposed explanations include retail buying concentrated at the open, compensation paid to liquidity providers for carrying overnight order imbalances, and the tendency for earnings and macro news to land outside regular trading hours — none proven as the sole cause.
- A 2026 New York Fed analysis found one historically strong window's effect has faded to near zero since 2021, underscoring that this is a time-varying anomaly, not a fixed rule.
- Gap risk, transaction costs/slippage, and thin after-hours liquidity are the main practical obstacles — illustrated by "night effect" ETFs that failed to gather assets and were shut down.
- The overnight effect doesn't imply day trading is inferior; intraday and overnight returns reflect different mechanisms, and should be evaluated as separate, non-competing parts of a trading approach.