Trading Strategies · Lesson 38/57 · 11 min read
IV Crush Explained: Calculating the Expected Move and Choosing Straddles vs. Iron Condors
In this article
- What IV Crush Is: Why Option Prices Collapse the Moment Uncertainty Resolves
- IV vs. Realized Volatility: What the Market Priced In vs. What Actually Happened
- Calculating the Expected Move: What Straddle Pricing Tells You About the Market's Bet
- Long Volatility vs. Short Volatility: Straddles/Strangles vs. Iron Condors
- Worked Example 1: IV Looks Rich — When Selling Volatility Is Favored
- Worked Example 2: IV Looks Cheap — When Buying Volatility Is Favored
- IV Rank and IV Percentile: Is Volatility Actually Expensive Right Now?
- Limitations and Pitfalls
- FAQ
- Summary
What IV Crush Is: Why Option Prices Collapse the Moment Uncertainty Resolves
An option's price bundles together two very different pieces of information: how much time is left until expiration, and how much the market expects the underlying to move during that time — its implied volatility (IV). Stocks heading into an earnings report see that second component swell well beyond its usual level. Nobody knows in advance whether the numbers will beat or miss, or what guidance will say, so traders price that uncertainty directly into the premium of every call and put on the name.
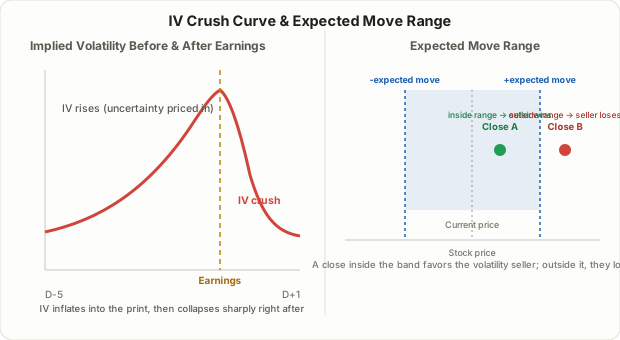
IV crush is what happens when that uncertainty resolves all at once at the moment of the report, and implied volatility deflates sharply as a result. Premiums that were inflated the day before the print can shrink dramatically within a single session once "here's what actually happened this quarter" becomes known information. What makes this worth understanding as its own phenomenon is that the collapse happens largely independent of direction — whether the stock gaps hard or barely moves, the specific uncertainty of "we don't know what's coming" disappears the instant the numbers are out, so IV tends to fall either way.
Understanding this requires bringing in a Greek that Lesson 24 on 0DTE options didn't need to lean on as heavily: vega, the sensitivity of an option's price to a one-point change in implied volatility. Where 0DTE is a story about time crushing an option's value, IV crush is a story about the market's own expectation of movement collapsing — and taking option prices down with it.
IV vs. Realized Volatility: What the Market Priced In vs. What Actually Happened
Implied volatility is, at bottom, a forecast — the market's best guess, baked into option prices, of how much the stock will move. What the stock actually does over that window gets measured after the fact as realized (or historical) volatility. Around earnings, a structural gap between the two shows up regularly.
- Before the report: uncertainty often pushes IV higher than the move that actually ends up happening on the day. For an option seller, that's a window where the "insurance premium" is priced rich.
- After the report: once the uncertainty resolves, IV tends to snap back down toward the stock's normal, quieter realized-volatility level.
That gap is why earnings-timed option-selling strategies — credit spreads, iron condors, short strangles — get described as "selling the IV crush." But it's worth being precise about what this is and isn't: this gap is not guaranteed to exist, and its size isn't predictable in advance. Some names see the market consistently overprice their earnings moves quarter after quarter; others see the opposite, where the actual move blows straight through what the options implied. The tool for sizing up that asymmetry ahead of time is the expected move, covered next.
Calculating the Expected Move: What Straddle Pricing Tells You About the Market's Bet
The expected move answers a specific question: roughly what percentage swing is the options market pricing in for this earnings report? The most commonly used shortcut backs it out of the at-the-money (ATM) straddle price.
Expected move (%) ≈ (ATM call price + ATM put price) ÷ current stock price × 100
Say a $100 stock has its nearest-expiration ATM call trading at $4 and the matching ATM put at $3.50. The straddle costs $7.50, which implies an expected move of roughly 7.5% — the options market is pricing in a decent chance the stock swings about 7.5% in either direction on the news. Some traders refine this further by multiplying the straddle price by roughly 0.85 (a rough adjustment for the residual time value still baked into the contracts), but it's worth being direct that this multiplier is a widely repeated convention among options traders, not a validated industry-standard formula.
The number itself matters less than what you compare it against: how this stock has actually moved on past earnings reports. That comparison is where the trading decision gets made.
Long Volatility vs. Short Volatility: Straddles/Strangles vs. Iron Condors
Once you've compared the expected move against what actually happened on past reports, that read has to translate into an actual position. Earnings option trades split broadly into "buying volatility" and "selling volatility," and the two sit at opposite ends of the payoff spectrum.
| Long straddle/strangle (buying volatility) | Iron condor/short strangle (selling volatility) | |
|---|---|---|
| Position | Buy the ATM call and put (or OTM call and put) of the same expiration | Sell calls/puts near the ATM strike, typically bought further out for protection |
| Favored when | The priced-in expected move is lower than the stock's typical past earnings move (IV looks cheap) | The priced-in expected move is higher than the stock's typical past earnings move (IV looks rich) |
| Payoff shape | Loss capped at premium paid; gain grows the bigger the move | Gain capped at premium received; loss grows the further price breaks outside the range |
| Effect of IV crush | Works against you — the value of the long options falls along with IV | Works in your favor — the value of the short options falls along with IV |
| What it's a bet on | "The market is underpricing how much this stock will move" | "The market is overpricing how much this stock will move" |
Both share one thing: neither is a bet on direction. A long straddle wins on a big move either way; an iron condor wins if the stock stays inside a range either way. That's a meaningfully different lens than the directional approaches covered in Lesson 3 on mean reversion or Lesson 4 on support/resistance breakouts — here, the bet is on the size of the move, not which way it goes.
Worked Example 1: IV Looks Rich — When Selling Volatility Is Favored
Say a $100 stock is heading into earnings with its ATM straddle priced at $8, implying an expected move of about 8%. Pulling up its last eight earnings reports, though, the stock's actual next-day move has averaged closer to 4-5% (setting aside one or two outsized swings). The market's current expectation (8%) sits noticeably above what this stock has actually delivered historically.
A commonly considered response is to sell volatility with an iron condor:
- Sell the $95 put, buy the $92 put (put spread, $3 wide)
- Sell the $105 call, buy the $108 call (call spread, $3 wide)
- Total premium collected across both spreads: $1.60 ($160 per contract, at a 100 multiplier)
If the stock closes anywhere between $95 and $105 — a range set somewhat inside the straddle-implied 8% band to lean on the stock's more conservative historical pattern — both spreads expire worthless and the trader keeps the full $160. If instead the stock closes above $108 or below $92, the loss is the spread width ($3) minus the premium collected ($1.60), or $1.40 ($140). That prices out to roughly $140 at risk to make $160 — a comparatively balanced setup by the standards of Lesson 6's discussion of risk/reward, though the actual ratio in any real trade depends heavily on strike width and premium received.
Worked Example 2: IV Looks Cheap — When Buying Volatility Is Favored
Now the mirror image. Same $100 stock, different quarter: the ATM straddle is priced at just $4 this time, implying an expected move of about 4%. But this company has been carrying real event risk lately — a new product launch, an ongoing lawsuit, a management change — and its last several earnings reports have actually moved the stock closer to 7-8% on average. Here the market's expectation (4%) sits below what's actually been happening.
A commonly considered response in this case is to buy volatility with a long straddle:
- Buy the ATM call and the ATM put, total premium $4 ($400)
- Breakeven sits at roughly $104 on the upside and $96 on the downside — the stock needs to clear the straddle's cost in either direction to turn a profit
If the stock moves 8% on the report, closer to its recent history, and lands at $108, the call alone is worth at least $8 (a solid gain against the $400 paid for both legs). If instead the stock has an unusually quiet quarter and only moves 2%, both legs finish under their breakevens and most of the $400 premium is lost — a loss driven not by getting the direction wrong, but by the move simply not being big enough.
IV Rank and IV Percentile: Is Volatility Actually Expensive Right Now?
A single straddle price only tells you IV is elevated in absolute terms — it doesn't say whether that's high for this particular stock. Two relative measures commonly fill that gap.
- IV rank: where current IV sits, on a 0-100 scale, relative to its highest and lowest readings over the past year (or another lookback window). An IV rank of 80 means IV has been higher than its current level less than 20% of the time over that window.
- IV percentile: the percentage of trading days over the lookback window where IV was lower than it is right now. The math differs slightly from IV rank, but the purpose is the same — telling you whether volatility is relatively expensive or cheap.
A commonly repeated rule of thumb says to lean toward selling volatility when IV rank is elevated (say, above 50) and toward buying it when IV rank is low — but that threshold is a loose convention circulating among options traders, not a statistically validated cutoff. For an earnings-specific decision, comparing the expected move directly against the stock's own past earnings moves, as in the two examples above, is a more direct signal than IV rank on its own.
Limitations and Pitfalls
- The expected move is a probabilistic estimate, not a ceiling. Actual moves blow past the range implied by the options market often enough that it shouldn't be treated as a boundary. Volatility-selling positions like iron condors and short strangles are especially exposed to this tail risk — one outsized gap can erase the gains from several smaller winning trades.
- Liquidity can deteriorate right around the print. Bid-ask spreads often widen on the last trading day before the report and around the opening print the next day, and fills can land well away from where you expected.
- Overnight gaps make stop orders useless. Most earnings come out after the close or before the open, so a large opening gap gives a stop-loss order no chance to trigger mid-session. Position sizing has to account for that gap risk directly, not rely on a stop to cap it.
- "IV always crushes" is a dangerous assumption. The typical case is a post-earnings volatility drop, but the size and speed of that drop vary a lot by stock and market backdrop, and occasionally a follow-on event — a guidance dispute, a new lawsuit, a rating change — keeps IV elevated well past the report itself.
- Check margin, tax, and broker rules before you trade. Margin requirements on spread positions vary by broker, and some brokers temporarily raise margin requirements on names around earnings season — worth confirming ahead of time rather than discovering it at entry.
FAQ
What's the difference between a straddle and a strangle?
A straddle buys or sells a call and put at the same strike, usually at-the-money. A strangle uses two different strikes — typically an out-of-the-money call and an out-of-the-money put. A strangle costs less than a straddle but needs a bigger move to reach breakeven. Both express the same underlying view (a big move either way, or the opposite bet on a tight range), just with different capital efficiency and breakeven distances.
Does the actual move always come in smaller than the expected move?
No. The tendency for the market to overprice expected moves — as in the first worked example — is something options traders discuss often, but it's a pattern, not a rule, and it can flip depending on the stock and the specific quarter. Always check the individual stock's own history of past earnings moves rather than assuming the general tendency applies.
Is it fine to enter the trade the morning of the report?
It's possible, but by then IV is usually near its peak for the cycle, which tends to favor selling strategies (like iron condors) and work against buying strategies (a long straddle bought at peak IV is a more expensive entry). Entering a few days earlier gets a long straddle into a less inflated IV, but leaves uncertainty about how much further IV might climb before the print.
Summary
- IV crush is the sharp drop in implied volatility that follows an earnings report as uncertainty resolves, and it tends to happen regardless of which way the stock moves.
- The expected move can be approximated from ATM straddle pricing divided by the stock price, and the key step is comparing that number against the stock's actual past earnings moves.
- When the expected move is priced above the stock's historical pattern, selling volatility (iron condors, short strangles) is the commonly considered approach; when it's priced below, buying volatility (long straddles/strangles) is.
- IV rank and IV percentile are useful supporting gauges of whether volatility is relatively rich or cheap for a given stock, but for an earnings-specific decision, comparing the expected move directly to past history is more direct.
- The expected move is a probabilistic estimate, not a hard ceiling — tail risk, thinning liquidity, and overnight gaps all need to be weighed, and "the crush always happens" is not a safe assumption to trade on.