Trading Strategies · Lesson 63/63 · 8 min read
Renko Chart Trading: Setting Brick Size and Trend-Following Entry Rules
In this article
- What Makes Renko Different: Price Movement Instead of Time
- How a Brick Actually Gets Drawn: Two Conventions
- Sizing the Brick: The One Setting That Defines the Strategy
- Trading Rules: Enter on the Flip, Exit on the Reversal
- A Worked Example: How Bricks Actually Print
- Renko vs. Heikin-Ashi: Two Ways to Filter Noise, One Big Difference
- Limitations to Keep in Mind
- FAQ
- Summary
What Makes Renko Different: Price Movement Instead of Time
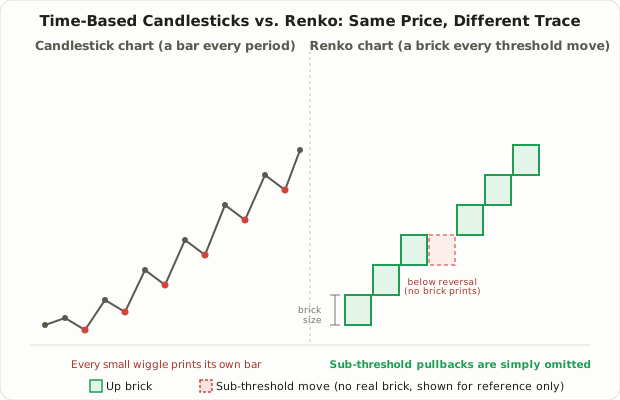
Every chart covered so far in this course — regular candlesticks, Heikin-Ashi, even Market Profile's TPO chart — shares one assumption: the x-axis is time. Whether you're on a 1-minute or a daily chart, a new bar prints every time a fixed interval passes, regardless of whether the price actually moved. In a quiet, range-bound market, that produces a chart cluttered with meaningless back-and-forth.
Renko charts throw out that assumption entirely. The x-axis isn't time — it's accumulated price movement. A new brick only appears once price has moved by a preset brick size, and if price doesn't move that much, no new brick appears whether an hour passes or a week does. The name comes from the Japanese word for brick (renga), and the chart really does look like a staircase of stacked bricks. Over the past few years, Renko has resurfaced across overseas trading-education YouTube channels and the TradingView community, usually framed as "the chart that shows only the trend, with the noise stripped out" — and it's steadily gained traction as a secondary chart among swing and scalping traders.
How a Brick Actually Gets Drawn: Two Conventions
The exact rule for printing a new brick varies slightly by platform, but two conventions dominate.
Traditional (high-low) method: a new brick prints once the closing price moves past the top (or bottom) of the last brick by one full brick size. To reverse direction after a run of up-bricks, price has to fall by twice the brick size from the top of the last brick — reversals require double the move that continuation requires, which makes direction-change signals noticeably more conservative.
Open-based method: each new brick's open is set equal to the previous brick's close, so a single brick-size move in either direction — continuation or reversal — prints a new brick immediately. Reversal signals fire faster and more often than under the traditional method.
Because the same price series can produce a different brick count and different reversal timing depending on which convention is used, it's worth confirming which one your charting platform defaults to before backtesting or trading off it.
Sizing the Brick: The One Setting That Defines the Strategy
Renko has essentially one meaningful setting — brick size — and it single-handedly determines what kind of strategy you end up trading.
| Brick Size | Behavior | Best Suited For |
|---|---|---|
| Small | Noise leaks back in; signals fire fast and often; higher whipsaw risk | Scalping, fast-reaction trading |
| Large | Noise is filtered out cleanly, but signals lag and pullbacks run deeper before a reversal prints | Swing trading, longer-horizon trend following |
There are two common approaches to setting it. The first is a fixed-percentage method — traders commonly cite roughly 0.5–1% of the instrument's current price as a starting brick size. The second is an ATR-based method, using the recent 14-period Average True Range directly as the brick size, or half of it. The appeal of the ATR approach is that brick size automatically scales with each instrument's own volatility — and adjusts as that instrument's volatility regime changes over time. To be clear, this is a widely cited rule of thumb among traders, not a fixed formula that works identically across every symbol and timeframe — it's the same volatility-measurement logic covered in Lesson 13's ATR stop-loss strategy, just repurposed for sizing bricks instead of stops.
Trading Rules: Enter on the Flip, Exit on the Reversal
The most basic form of a Renko-based strategy comes down to four steps.
- Confirm the trend. A run of three to five or more same-colored bricks in a row is generally treated as an established trend.
- Enter. After a counter-trend brick appears, enter on the first brick that flips back to the trend's original color (a more aggressive variant enters immediately on the color-flip brick itself).
- Set a stop. Renko charts don't carry precise time or price data on their own, so stops should always be set against a real candlestick chart or an ATR multiple — a common approach places the stop two to three bricks behind the entry direction.
- Exit. Common exits are either the first opposite-color brick, or a moving average overlaid directly on the Renko chart, exiting on a break below/above it.
Overlaying standard indicators like a moving average or MACD directly onto a Renko chart is common practice. Because each brick has already filtered out noise, the same indicator tends to produce noticeably smoother signals than it would on a regular candlestick chart. The catch is that the "close" feeding the indicator is the price at which each brick completed — not a real time-based closing price — and that distinction matters when interpreting the signal.
A Worked Example: How Bricks Actually Print
Suppose the brick size is set to $5, and the top of the last completed brick sits at $520 (using the traditional high-low convention).
- Price rises to $523 → short of the $5 threshold, no new brick
- Price rises to $526 → clears $520 + $5 = $525, so one up-brick prints, with its top now at $525
- Price then falls to $522 → a reversal needs $10 (twice the brick size), which would require falling to $525 − $10 = $515; not met, so nothing changes
- Price falls further to $514 → clears $515, so one down-brick prints
Notice what happens between $523 and $522: that entire back-and-forth leaves zero trace on the Renko chart. A time-based candlestick chart would have plotted several candles across that same stretch. That's the clearest illustration of what Renko actually does — it keeps only the moves it considers meaningful and discards everything else.
Renko vs. Heikin-Ashi: Two Ways to Filter Noise, One Big Difference
Renko and Heikin-Ashi share the same goal — cut through noise and make the trend easier to read — but they get there through fundamentally different mechanics.
| Renko | Heikin-Ashi | |
|---|---|---|
| X-axis basis | Price movement (time is ignored) | Time (same as regular candles) |
| How noise is removed | Sub-threshold moves are simply omitted | Values are averaged with the prior candle |
| Volume / exact timing | Unavailable — only brick-completion order exists | Preserved, since the time axis is unchanged |
| Signal character | Pullbacks are fully ignored; staircase-style signals | Pullbacks are absorbed but color can shift gradually |
| Suitable for stops/targets | No — needs a real candlestick chart alongside it | No — needs a real candlestick chart alongside it |
| Behavior in range-bound markets | Bricks barely print at all — near-total signal silence | Short bodies with wicks on both sides still give a warning cue |
The biggest practical gap is whether time survives on the chart at all. Heikin-Ashi still prints a candle every period, so it's easy to line up against a news release or volume spike. Renko doesn't show when a brick actually completed unless the platform adds a separate timestamp overlay. The more accurate way to think about them: Renko is a tool for filtering the broad direction of the trend, while Heikin-Ashi is a tool for reading trend strength through candle shape — different jobs, not competing versions of the same idea.
Limitations to Keep in Mind
- Volume and precise timing disappear. Because bricks don't map cleanly to real time intervals, Renko doesn't combine well with time- and volume-based analysis like Lesson 16's order flow and footprint reading.
- Brick-size selection carries real curve-fitting risk. A brick size that looks perfect on historical data can stop working the moment volatility shifts to a different regime.
- Gaps aren't represented honestly. An overnight gap-up or gap-down gets sliced into brick-sized increments rather than shown as the single sharp jump it actually was, which erases the real speed and size of the gap.
- Range-bound markets produce almost no signal at all. If price stays within one brick's width, no new brick prints for hours or even days — which can create the illusion that nothing is happening, when in fact the market is simply chopping sideways.
- It's not recommended as a standalone trading tool. Precise entries, stops, and volume confirmation still require a real candlestick chart alongside it; using Renko purely to filter for the broader trend direction is the more commonly practiced approach.
FAQ
What timeframe works best with Renko charts?
Renko doesn't really have a timeframe in the traditional sense — brick size effectively plays that role instead. A small brick size behaves like a fast, scalping-oriented timeframe, while a large brick size behaves like a slower, swing-trading-oriented one.
Can I trade off Renko charts alone?
It's not generally recommended. Because volume and exact execution timing are missing, pinpointing precise entries and stops is difficult. The more common practice is to use Renko to filter the broader trend direction, then set actual entries and stops against a real candlestick chart.
How often should brick size be adjusted?
There's no fixed rule, but many traders recompute brick size from ATR around earnings season or major macro events, when volatility regimes tend to shift. It's also worth keeping in mind that changing brick size too frequently can undermine the consistency of the signals you're trying to read.
Summary
- Renko charts use accumulated price movement, not time, as the x-axis — a new brick only prints once price moves by a preset brick size.
- The traditional method requires twice the brick size to reverse direction, producing more conservative signals; the open-based method reverses on a single brick-size move, producing faster and more frequent signals.
- Brick size is set either as a fixed percentage of price or from ATR; smaller sizes suit scalping, larger sizes suit swing trading.
- A common entry rule buys on the trend color's reappearance after a pullback brick, with exits on the first opposite-color brick or a break of a moving average overlaid on the Renko chart.
- Like Heikin-Ashi, the goal is noise reduction, but Renko removes the time axis entirely — which means volume and exact timing are lost, and entries, stops, and targets should always be confirmed against a real candlestick chart.