Trading Strategies · Lesson 76/76 · 8 min read
Stochastic Oscillator Trading: Fast vs. Slow Stochastic, %K/%D Crossovers and Divergence
In this article
- What the Stochastic Oscillator Measures: Where the Close Sits Inside the Recent Range
- The Math: %K and %D
- Reading the Signal: Overbought/Oversold Crossovers
- Fast Stochastic vs. Slow Stochastic
- Divergence: When Price and Momentum Disagree
- Stochastic RSI: A Variant Getting More Attention Lately
- Limitations to Keep in Mind
- FAQ
- Summary
What the Stochastic Oscillator Measures: Where the Close Sits Inside the Recent Range
The Stochastic Oscillator was developed by George C. Lane in the late 1950s and remains one of the oldest, most widely taught momentum tools alongside MACD and ADX from earlier lessons. The core observation behind it is simple: in an uptrend, closing prices tend to cluster near the top of the recent high-low range, while in a downtrend they tend to cluster near the bottom. Lane is often credited with the line "the stochastic doesn't follow price, it follows the speed of price" — the idea being that before a trend actually reverses, the tendency of closes to hug one edge of the range starts weakening first.
It overlaps in purpose with RSI, covered in the momentum trading and four mean-reversion tools lessons, but the math is different. RSI measures a ratio of average gains to average losses. The Stochastic Oscillator instead measures where the current close falls, as a percentage, inside the high-low range of a fixed lookback window.
The Math: %K and %D
The indicator has two lines.
- %K (raw stochastic): %K = (Close − Lowest Low over N periods) ÷ (Highest High over N periods − Lowest Low over N periods) × 100
- %D (signal line): an M-period simple moving average of %K
The most common default is 14, 3, 3 — 14 periods for the high/low lookback, the first 3 for smoothing %K once, and the second 3 for the moving average that produces %D. Like RSI, it's a bounded oscillator that only moves between 0 and 100, which makes it directly comparable across stocks trading at very different price levels.
A Worked Numeric Example
Suppose a stock's 14-day high is $68.00, its 14-day low is $60.00, and today's close is $65.60:
%K = (65.60 − 60.00) ÷ (68.00 − 60.00) × 100 = 5.60 ÷ 8.00 × 100 = 70
The close sits 70% of the way up the range. If the last three days' %K readings were 70, 74, and 78, then %D (a 3-day simple average) = (70+74+78)/3 = 74. Since %K (70) is still below %D (74), the crossover hasn't happened yet — if %K climbs further the next day and crosses above %D, that moment is typically read as a bullish signal.
Reading the Signal: Overbought/Oversold Crossovers
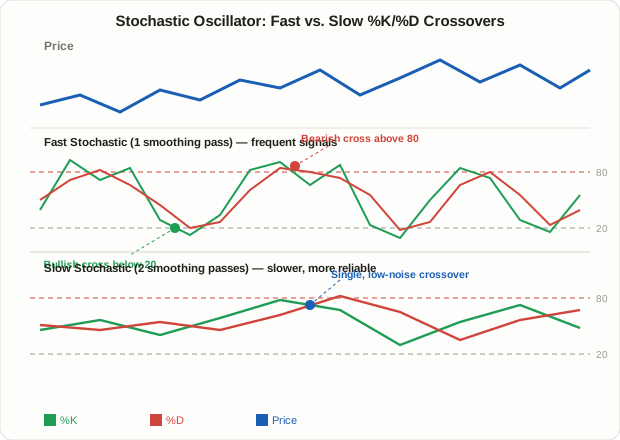
The basic trading signal is a %K/%D crossover occurring inside the overbought or oversold zone.
- Bullish candidate: %K crosses above %D while both are in the oversold zone (20 or below)
- Bearish/exit candidate: %K crosses below %D while both are in the overbought zone (80 or above)
Like the 25 threshold on ADX, the 80/20 levels are a widely cited industry convention, not a fixed law. Some traders loosen them to 70/30 for more volatile names or stronger-trending markets.
A key caveat: in a strong trend, the Stochastic Oscillator can stay pinned in overbought or oversold territory for an extended stretch. In a powerful uptrend, closes keep printing near the top of the range, so %K can sit above 80 for days or weeks at a stretch. Treating every bearish crossover during that stretch as a sell signal means exiting far too early, over and over, while the trend keeps running. For that reason, the Stochastic Oscillator tends to work best in range-bound, sideways markets, and it's generally recommended to pair it with a trend-strength filter like ADX when the market is clearly trending.
Fast Stochastic vs. Slow Stochastic
There are two versions of the indicator that differ in how many smoothing steps they apply — and understanding this difference matters more than almost anything else when using it.
- Fast Stochastic: uses the raw %K with no smoothing, and %D is simply a moving average of that raw %K. It reacts instantly to price but produces a lot of noise.
- Slow Stochastic: takes Fast Stochastic's %D and redefines it as the new %K (one extra smoothing pass), then applies another moving average on top to produce a new %D. The extra smoothing step means slower signals but fewer false ones.
| Fast Stochastic | Slow Stochastic | |
|---|---|---|
| Smoothing passes | 1 | 2 |
| Signal speed | Fast | Relatively slow |
| Signal frequency | High — especially choppy in sideways markets | Lower |
| Main risk | Frequent whipsaws | Entries can lag, shrinking the available move |
| Best suited for | Intraday scalping on low timeframes | Daily/weekly swing trading |
| Practice note | Most charting platforms label their default "stochastic" the Slow version | Closer to the version Lane himself favored in practice |
Rather than one being universally "correct," the practical choice usually comes down to matching the indicator to your own trading timeframe — Fast Stochastic for rapid intraday scalps, Slow Stochastic for daily or weekly swing positions.
Divergence: When Price and Momentum Disagree
The divergence concept from the MACD lesson applies directly here.
- Bullish divergence: price makes a lower low, but the Stochastic Oscillator prints a higher low. Price is still falling, but selling pressure at the bottom is fading — commonly read as an early warning sign.
- Bearish divergence: price makes a higher high, but the Stochastic Oscillator's high is lower than its previous one. Price climbed, but the force behind that climb is already weakening.
Because the Stochastic Oscillator is bounded between 0 and 100, divergence can appear and disappear repeatedly during a strong trend while price keeps grinding in the same direction. It's widely recommended to treat divergence as a warning flag rather than a standalone entry trigger, pairing it with an independent confirmation such as a trendline break or reversal candle.
Stochastic RSI: A Variant Getting More Attention Lately
A variant that comes up often in current trading-education content, especially around crypto and short-term trading, is Stochastic RSI (StochRSI). Instead of applying the stochastic formula to price, it applies it to RSI values themselves — effectively "the RSI of the RSI." The formula is StochRSI = (Current RSI − Lowest RSI over N periods) ÷ (Highest RSI over N periods − Lowest RSI over N periods) × 100 — the same %K formula as regular stochastic, but with RSI plugged in instead of price.
StochRSI swings far more sharply and sensitively than plain RSI, so overbought/oversold signals fire much more often. That makes it appealing for very short-term traders, but it comes with a direct trade-off: more signals also means more false ones. It's important not to confuse price-based Stochastic with RSI-based StochRSI — the former measures price's position inside its own range, while the latter measures an already-processed value (RSI) inside its own range.
Limitations to Keep in Mind
- A fundamental limitation of bounded oscillators: the stronger the trend, the longer it can stay pinned at an extreme, so using it as a pure counter-trend signal risks exiting winners or entering losers too early.
- Not recommended as a standalone tool: Lane himself is widely said to have treated it as a confirmation tool rather than a primary trend signal, and pairing it with price structure or volume is standard practice.
- Most reliable in range-bound markets: crossovers in the overbought/oversold zones tend to have a higher hit rate in sideways, directionless conditions; in a clearly trending market, filtering with a trend-strength tool like ADX first is generally advised.
- The defaults are convention, not law: the 14-3-3 settings and the 80/20 thresholds are all industry convention rather than a fixed rule, and traders commonly adjust them per instrument and timeframe.
FAQ
Is the Stochastic Oscillator better than RSI?
Neither is universally superior. RSI measures the ratio of average gains to losses and tends to produce more stable divergence signals, while the Stochastic Oscillator measures position within the range and reacts faster and more sensitively. Many traders run both side by side as independent confirmation angles.
Should I use Fast or Slow Stochastic?
It depends on your trading timeframe. Fast Stochastic's quicker reaction can be an advantage for intraday scalping on low timeframes, while Slow Stochastic's reduced whipsaw tends to be more useful for daily or weekly swing trading. Most charting platforms default to the Slow version.
Do I have to stick to the 80/20 overbought/oversold levels?
No. 80/20 is simply the most commonly cited convention, not a fixed rule that fits every stock and timeframe. Traders sometimes loosen the thresholds to 70/30 for more volatile instruments, and many adjust them after checking how a specific stock's range has historically behaved.
Summary
- The Stochastic Oscillator is a bounded, 0–100 momentum indicator built from %K (the close's position within an N-period high-low range) and its smoothed version, %D.
- The default settings are 14, 3, 3, with readings above 80 commonly read as overbought and below 20 as oversold — both are industry convention, not fixed law.
- Fast Stochastic applies one smoothing pass, producing fast, frequent signals; Slow Stochastic applies an extra pass for slower but typically more reliable signals — the right choice depends on your trading timeframe.
- Divergence works the same way it does with MACD, flagging disagreement between price and momentum direction, but loses reliability in strong trends, so pair it with independent confirmation.
- Stochastic RSI, which applies the stochastic formula to RSI instead of price, is increasingly discussed in short-term trading circles — it's far more sensitive than plain RSI, which means more signals but also more false ones.
- Because it's a bounded oscillator, it's easy to misuse as a counter-trend signal in a strong trend, so pairing it with a trend-strength filter like ADX or price structure confirmation is the safer approach.