Trading Strategies · Lesson 75/75 · 9 min read
Index Inclusion Effect: Trading the Passive Rebalancing Flow Before S&P 500 and KOSPI 200 Additions
In this article
- What Is the Index Inclusion Effect: Trading Mechanical Flow, Not a Judgment Call
- Why It Works: The Downward-Sloping Demand Curve
- The Timeline: Announcement, Effective Date, and the Unwind
- The Trade: "Buy the Announcement, Sell the Effective Date"
- A Worked Example (Simplified, for Teaching Purposes Only)
- Comparing S&P 500, KOSPI 200, and MSCI Rebalancing
- The Disappearing Edge
- Risks and Limitations
- FAQ
- Summary
What Is the Index Inclusion Effect: Trading Mechanical Flow, Not a Judgment Call
The index inclusion effect describes what happens to a stock's price when it gets added to a major benchmark like the S&P 500, KOSPI 200, or an MSCI index — a price move driven entirely by the mechanics of index tracking, not by anything the company actually did. The logic is almost mechanical. A passive fund tracking the S&P 500 doesn't buy a newly added stock because it likes the company; it buys because the stock is now in the index, in the exact weight the index assigns it, on a fixed date, regardless of price. That price-insensitive, forced demand is what this strategy tries to get ahead of.
That makes it a different animal from almost everything else in this course. Moving averages and RSI (covered in Lesson 2) read price behavior, and order blocks (covered in Lesson 39) try to trace smart-money footprints — but neither involves a buyer with zero discretion about price or timing. The index inclusion trade is interesting precisely because passive investing keeps growing as a share of total market ownership, which means the absolute dollar size of this forced, mechanical flow keeps growing with it.
Why It Works: The Downward-Sloping Demand Curve
Classic efficient-market theory assumes a stock's demand curve is close to flat — if the price ticks up even slightly, informed investors should happily substitute into a similar stock instead, so no single name should ever be "must-own." In 1986, Andrei Shleifer's paper "Do Demand Curves for Stocks Slope Down?" challenged that assumption directly: stocks newly added to the S&P 500 showed a clear, statistically significant abnormal return right around the announcement. His explanation was that index funds have no substitute. A fund tracking the S&P 500 has to own the specific stocks in the S&P 500 — nothing else will do — which means the demand curve for that stock is far steeper (more price-inelastic) than standard theory predicts.
Put a dollar figure behind that and the mechanism gets concrete. When a stock joins the S&P 500, every fund replicating that index has to buy shares in the exact weight the index now assigns — often executed right at the market-on-close (MOC) auction on the effective date, because that's the only print every tracking fund can match simultaneously. There's no haggling and no discretion to wait for a better entry. That inelastic demand gets compressed into the narrow window between the announcement and the effective date, and that compression is the real substance of the index inclusion effect. Removals work the same way in reverse: a stock dropped from the index faces the identical mechanism as forced selling.
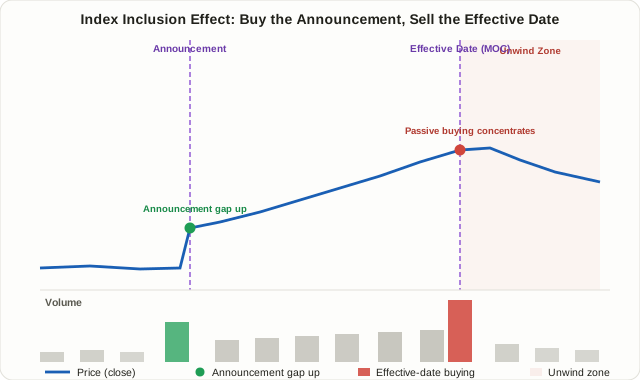
The Timeline: Announcement, Effective Date, and the Unwind
Traders who target this effect almost always break it into three stages.
- Announcement date. The S&P 500 can announce changes on virtually any schedule (it also runs quarterly reconstitutions), while KOSPI 200 runs fixed semiannual reviews (June and December) and MSCI reviews quarterly, with the May and November semiannual reviews carrying more weight than the February and August quarterly ones. The moment a change is announced, traders who've been positioning for it often start buying immediately, producing the first leg up.
- The run-up to the effective date. There's usually a one-to-three-week gap between announcement and the date the change actually takes effect. Because the coming demand is now public knowledge, additional buyers tend to keep piling in during this window, and price often grinds higher in a fairly steady, stair-step pattern.
- The effective date and after. On the effective date itself, the actual passive buying concentrates heavily in the closing auction, and volume frequently spikes to several multiples of normal. This is the textbook "buy the rumor, sell the news" moment — traders who positioned early often use that volume spike to exit into it, and multiple academic studies have documented at least a partial unwind of the earlier gains in the days and weeks that follow.
The Trade: "Buy the Announcement, Sell the Effective Date"
The skeleton of the practical trade is simple: buy around the announcement and exit at or before the effective date, using the guaranteed passive buying at the close as the liquidity you sell into.
- Entry timing. Some traders buy at the close on the announcement day itself; others try to front-run the announcement by buying stocks the market already expects to be added, which offers a bigger potential payoff but carries real risk if the guess is wrong.
- Exit timing. Common practice is to exit before or right into the effective-date closing auction, since that's exactly when the forced buying is concentrated. Holding through the effective date and beyond runs against the whole point of the trade — you'd be holding into the exact moment the edge is supposed to be realized, not after.
- The mirror trade: shorting removals. A stock dropped from an index faces the same mechanism as forced selling, so shorting index deletions is the theoretical flip side. In practice, deletions are often already in a downtrend for fundamental reasons, so borrow costs can be high and short-squeeze risk (see Lesson 23) is a real consideration.
A Worked Example (Simplified, for Teaching Purposes Only)
This is a hypothetical illustration of the mechanics, not a real trade record.
| Item | Value | Note |
|---|---|---|
| Estimated AUM tracking the S&P 500 | ~$15 trillion | Rough, simplified estimate across ETFs, funds, and pensions |
| New stock's index weight | 0.15% | Based on float-adjusted market cap |
| Estimated forced passive buying | ~$22.5 billion | $15T × 0.15% (simplified) |
| Stock's average daily dollar volume (ADV) | ~$3 billion | Trailing 20-day average |
| Estimated buying as a multiple of ADV | ~7.5x | $22.5B ÷ $3B |
The last row is the number that matters most. The bigger the forced passive buying is relative to a stock's normal trading volume, the larger the potential price impact — that's the core assumption behind sizing up which candidates are worth watching. A mega-cap stock with enormous existing volume will absorb the same percentage weight far more quietly than a mid-cap name will. This is a rough sizing heuristic for comparing candidates against each other, not a formula that predicts an exact price move.
Comparing S&P 500, KOSPI 200, and MSCI Rebalancing
The three benchmarks differ enough in mechanics that the details of the trade shift depending on which index is involved.
| S&P 500 | KOSPI 200 | MSCI (Korea weight) | |
|---|---|---|---|
| Reconstitution schedule | Quarterly, plus ad hoc changes | Twice a year (June, December) | Four times a year (Feb, May, Aug, Nov); May/Nov carry more weight |
| Inclusion criteria | Committee discretion on top of quantitative screens | Mostly rules-based (float-adjusted market cap, etc.) | Mostly rules-based (float-adjusted market cap, liquidity) |
| Announcement-to-effective lag | Usually days to about a week | Roughly two weeks | Roughly two weeks |
| Where buying concentrates | Effective-date closing auction | Effective-date closing auction | Effective-date closing auction |
Because the S&P 500's committee can pass over a stock that meets the quantitative criteria, it carries more unpredictability than KOSPI 200 or MSCI, both of which lean on transparent, formula-driven rules that make it comparatively easier for the market to guess the next addition ahead of time. That's exactly why KOSPI 200 and MSCI candidates often see early positioning well before the official announcement.
The Disappearing Edge
This part matters as much as the mechanism itself. Since Shleifer's 1986 paper, enough capital has piled into exploiting this exact effect that later research has found the edge shrinking over time. Robin Greenwood and Marco Sammon's research, fittingly titled "The Disappearing Index Effect," documents that abnormal returns around index additions have faded, and points to the growth of arbitrage capital chasing this very trade as the reason — a classic case of a well-known anomaly getting arbitraged away as more people try to exploit it, with the effect increasingly priced in before the announcement even happens.
That's a reason for caution, not a reason to ignore the mechanism. Treat the underlying logic — forced buying pushes price up into the effective date, some of that gives back afterward — as directionally real, but don't anchor to any specific win rate or average return quoted in a single study or article; sample periods and stock selection vary enormously, and whatever edge remains has likely gotten smaller since the data was collected.
Risks and Limitations
- Committee discretion. The S&P 500 in particular can skip a stock the market widely expected to be added, which can leave front-runners holding a position with no catalyst behind it.
- Overlapping catalysts. If the inclusion announcement lands near an earnings report or other news, it becomes hard to separate the index effect from everything else moving the stock.
- Unwind timing is unpredictable. How much of the run-up gives back, and when, varies a lot by stock — holding through the effective date risks getting caught in exactly that unwind.
- Shorting deletions is harder than it looks. Borrow availability, fees, and short-squeeze risk make the removal trade meaningfully harder to execute than the addition trade.
- Size cuts both ways. If the added stock is already a heavily traded mega-cap, the forced buying may be small relative to ADV and barely move price at all. As covered in Lesson 6, a smaller expected edge calls for correspondingly more conservative risk sizing.
FAQ
Is it safe to buy immediately on the announcement?
It's possible, but it's the riskiest entry point. A chunk of the move may already be priced into the announcement-day gap, and how much further upside is left into the effective date varies a lot by stock. Buying ahead of the announcement, buying on the announcement day, and buying close to the effective date are three different risk/reward profiles — know which one you're taking.
How is this different from following 13F filings?
13F tracks a specific manager's judgment, reported with up to a 45-day lag. The index inclusion effect tracks a largely mechanical, near-certain buying schedule with a much shorter lag — but that shorter lag also means far more people are watching the same trade.
Which benchmark offers a better edge, KOSPI 200 or the S&P 500?
There's no clean answer. KOSPI 200 and MSCI's transparent, rules-based criteria make candidates easier to forecast, but that same transparency means the market tends to price the move in faster. The S&P 500's committee discretion adds uncertainty, but once an addition is confirmed, the pool of tracking capital behind it is considerably larger.
Summary
- The index inclusion effect targets the price impact of forced, price-insensitive buying that passive funds must execute when a stock joins a major index.
- Shleifer's 1986 research first documented this systematically, explaining it through a downward-sloping demand curve: index-tracking capital has no substitute for the specific stock in the index.
- The practical trade is "buy the announcement, sell the effective date" — using the guaranteed close-of-day passive buying on the effective date as the exit liquidity.
- S&P 500, KOSPI 200, and MSCI differ in rebalancing frequency and in how discretionary vs. rules-based their inclusion criteria are, which changes how predictable and how quickly priced-in each index's additions tend to be.
- Research also shows this exact edge shrinking as more arbitrage capital chases it, so treat historical return figures as directional evidence rather than a fixed, repeatable statistic, and size risk conservatively.